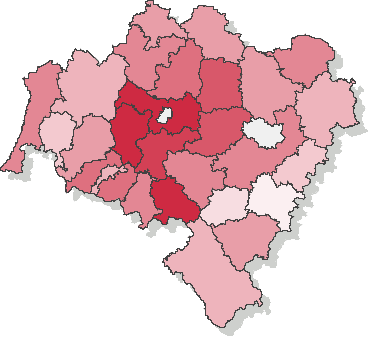
Voting turnout - 2nd ballot on 26.11.2006
| dolnośląskie | |||||||||||||||||||||||||||||
|---|---|---|---|---|---|---|---|---|---|---|---|---|---|---|---|---|---|---|---|---|---|---|---|---|---|---|---|---|---|
|
|
||||||||||||||||||||||||||||
|
|||||||||||||||||||||||||||||
* - Dane na podstawie protokołów.
Voting turnout - counties (province Lower Silesia) in the 2nd ballot on November 26th 2006
Go to top| Name | Number of electors | Number of dispensed ballot cards | Number of precincts | Number of precincts with no data supplied | Voting turnout | |
|---|---|---|---|---|---|---|
| bolesławiecki | 49540 | 17427 | 34 | — | 35.18% |
|
| dzierżoniowski | 44780 | 14106 | 38 | — | 31.50% |
|
| głogowski | 60233 | 23144 | 39 | — | 38.42% |
|
| górowski | 18959 | 7114 | 18 | — | 37.52% |
|
| jaworski | 18606 | 8900 | 19 | — | 47.83% |
|
| jeleniogórski | 31232 | 13409 | 34 | — | 42.93% |
|
| kamiennogórski | 27442 | 11413 | 20 | — | 41.59% |
|
| kłodzki | 89503 | 31515 | 75 | — | 35.21% |
|
| legnicki | 24429 | 12638 | 28 | — | 51.73% |
|
| lubański | 36184 | 12624 | 34 | — | 34.89% |
|
| lubiński | 17243 | 7650 | 17 | — | 44.37% |
|
| lwówecki | 31545 | 11923 | 30 | — | 37.80% |
|
| milicki | 19073 | 7717 | 20 | — | 40.46% |
|
| oleśnicki | 54689 | 20187 | 40 | — | 36.91% |
|
| oławski | 53339 | 17575 | 39 | — | 32.95% |
|
| polkowicki | 40854 | 17111 | 34 | — | 41.88% |
|
| strzeliński | 17889 | 4980 | 14 | — | 27.84% |
|
| średzki | 13663 | 6357 | 10 | — | 46.53% |
|
| świdnicki | 59181 | 24291 | 50 | — | 41.05% |
|
| trzebnicki | 37887 | 14342 | 25 | — | 37.85% |
|
| wałbrzyski | 7668 | 3792 | 6 | — | 49.45% |
|
| wołowski | 38313 | 17334 | 35 | — | 45.24% |
|
| wrocławski | 23195 | 9747 | 17 | — | 42.02% |
|
| ząbkowicki | 42440 | 16229 | 49 | — | 38.24% |
|
| zgorzelecki | 55649 | 22565 | 46 | — | 40.55% |
|
| złotoryjski | 11458 | 5802 | 15 | — | 50.64% |
|
Turnout in cities holding county rights in the 2nd ballot on November 26th 2006
Go to top| Name | Number of electors | Number of dispensed ballot cards | Number of precincts | Number of precincts with no data supplied | Voting turnout | |
|---|---|---|---|---|---|---|
| m. Jelenia Góra | 71074 | 26104 | 45 | — | 36.73% |
|