Voting turnout
- 2nd ballot on 26.11.2006
| podlaskie |
|
|
| Province |
podlaskie |
| Number of counties* |
15 |
| Number of inhabitants* |
1,207,107 |
| Number of electors*
(in the 2nd ballot)
|
512,583
|
| Number of dispensed ballot cards*
(in the 2nd ballot)
|
196,426
|
| Number of precincts*
(in the 2nd ballot)
|
420
|
|
Voting turnout*
(in the 2nd ballot)
|
38%
|
| |
| Ballot on - 12.11.2006 |
| Frekwencja ogólna |
| Voting turnout at 1200 |
| Voting turnout at 1630 |
| |
| 2nd ballot on - 26.11.2006 |
|
| no data |
28.29
-
32.15
|
32.16
-
36.02
|
36.03
-
39.9
|
39.91
-
43.77
|
43.78
-
47.64
|
47.65
-
51.51
|
51.52
-
55.38
|
55.39
-
59.26
|
59.27
-
63.13
|
63.14
-
67.01
|
| |
|
|
|
|
|
|
|
|
|
|
|
* - Dane na podstawie protokołów.
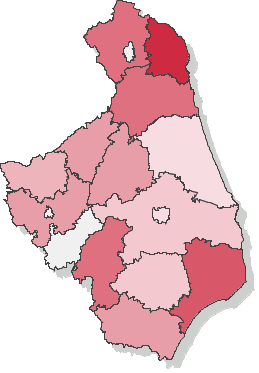
Voting turnout - counties (province Podlachia)
in the 2nd ballot on November 26th 2006
Go to top
Turnout in cities holding county rights
in the 2nd ballot on November 26th 2006
Go to top
| Name |
Number of electors |
Number of dispensed ballot cards |
Number of precincts |
Number of precincts with no data supplied |
Voting turnout |
|
|
m. Białystok
|
226419
|
79458
|
162
|
—
|
35.09%
|

|
|
m. Łomża
|
49362
|
13965
|
33
|
—
|
28.29%
|
|