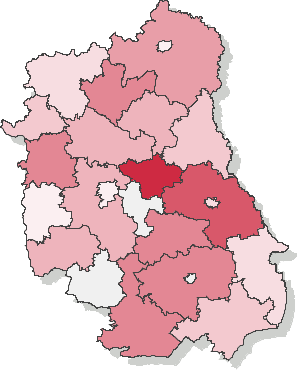
Voting turnout - 2nd ballot on 26.11.2006
| lubelskie | |||||||||||||||||||||||||||||
|---|---|---|---|---|---|---|---|---|---|---|---|---|---|---|---|---|---|---|---|---|---|---|---|---|---|---|---|---|---|
|
|
||||||||||||||||||||||||||||
|
|||||||||||||||||||||||||||||
* - Dane na podstawie protokołów.
Voting turnout - counties (province Lublin) in the 2nd ballot on November 26th 2006
Go to top| Name | Number of electors | Number of dispensed ballot cards | Number of precincts | Number of precincts with no data supplied | Voting turnout | |
|---|---|---|---|---|---|---|
| bialski | 28733 | 14623 | 24 | — | 50.89% |
|
| biłgorajski | 38296 | 21721 | 51 | — | 56.72% |
|
| chełmski | 8899 | 4081 | 11 | — | 45.86% |
|
| hrubieszowski | 25245 | 10063 | 26 | — | 39.86% |
|
| krasnostawski | 6908 | 3989 | 12 | — | 57.74% |
|
| kraśnicki | 42748 | 21302 | 38 | — | 49.83% |
|
| lubartowski | 39004 | 18822 | 43 | — | 48.26% |
|
| lubelski | 33166 | 16033 | 32 | — | 48.34% |
|
| łęczyński | 3990 | 2937 | 4 | — | 73.61% |
|
| łukowski | 32584 | 12931 | 22 | — | 39.69% |
|
| opolski | 5788 | 2059 | 6 | — | 35.57% |
|
| parczewski | 21172 | 9967 | 26 | — | 47.08% |
|
| puławski | 16814 | 9614 | 20 | — | 57.18% |
|
| radzyński | 13270 | 7253 | 10 | — | 54.66% |
|
| rycki | 20393 | 9392 | 24 | — | 46.06% |
|
| tomaszowski | 39281 | 17695 | 43 | — | 45.05% |
|
| włodawski | 24642 | 11620 | 29 | — | 47.16% |
|
| zamojski | 14905 | 8236 | 24 | — | 55.26% |
|
Turnout in cities holding county rights in the 2nd ballot on November 26th 2006
Go to top| Name | Number of electors | Number of dispensed ballot cards | Number of precincts | Number of precincts with no data supplied | Voting turnout | |
|---|---|---|---|---|---|---|
| m. Biała Podlaska | 45159 | 17082 | 26 | — | 37.83% |
|
| m. Chełm | 55088 | 22456 | 36 | — | 40.76% |
|
| m. Lublin | 276023 | 99670 | 204 | — | 36.11% |
|