Komitet Wyborczy Wyborców Samorządny Rozwój Żywiecczyzny
| Name: | Komitet Wyborczy Wyborców Samorządny Rozwój Żywiecczyzny | |
| Short name: | KWW Samorządny Rozwój Żywiecczyzny | |
| Type of committee: | Election committees established by electors | |
| Address: | ul. Węglowa 21, 34-300 Żywiec | |
| Plenipotentiary: | electoral | financial |
| Henryk Zając | Henryk Ozaist | |
The provinces where the committee has submitted lists of candidates
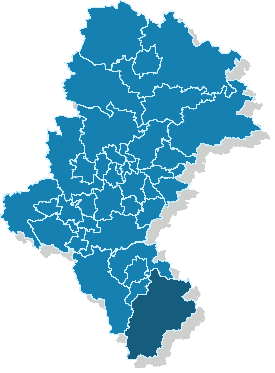
| Name |
|---|
| pow. żywiecki |
The statistics of election committe
Lists submitted
| Description | Number of |
|---|---|
| Number of lists submitted for province council | 0 |
| Number of lists submitted for county councils | 6 |
| Number of lists submitted for councils of cities holding county rights | 0 |
| Number of lists submitted for districts councils of the cap. city of Warsaw | 0 |
| Number of lists registered for communal councils | 26 |
| Totalling | 32 |
Submitted candidates
| Name | Number of candidates | Women | Women (%) | Men | Men (%) |
|---|---|---|---|---|---|
| Number of candidates submitted for the province council | 0 | 0 | - | 0 | - |
| Number of candidates submitted for county councils | 52 | 10 | 19.23% | 42 | 80.77% |
| Number of candidates submitted for councils of cities holding county rights | 0 | 0 | - | 0 | - |
| Number of candidates submitted for districts councils of the cap. city of Warsaw | 0 | 0 | - | 0 | - |
| Number of candidates registered for communal councils | 86 | 17 | 19.77% | 69 | 80.23% |
| Number of candidates submitted for reeve, mayor and presidential elections | 5 | 0 | 0.00% | 5 | 100.00% |
| Totalling | 143 | 27 | 18.88% | 116 | 81.12% |
Average age of submitted candidates
| Name | Average age | Average age of women | Average age of men |
|---|---|---|---|
| Average age of candidates submitted for the province council | - | - | - |
| Average age of candidates submitted for county councils | 44 | 41 | 45 |
| Average age of candidates for councils of cities holding county rights | - | - | - |
| Average age of candidates for districts councils of the cap. city of Warsaw | - | - | - |
| Average age of candidates submitted for communal councils | 42 | 40 | 43 |
| Average age of candidates for reeve, mayor, president | 45 | - | 45 |
| Totalling | 43 | 40 | 44 |
Submitted candidates grouped by age
| Name | Number of candidates | Women | Women (%) | Men | Men (%) |
|---|---|---|---|---|---|
| 18-29 | 24 | 5 | 20.83% | 19 | 79.17% |
| 30-39 | 30 | 6 | 20.00% | 24 | 80.00% |
| 40-49 | 36 | 8 | 22.22% | 28 | 77.78% |
| 50-59 | 41 | 7 | 17.07% | 34 | 82.93% |
| 60-69 | 10 | 1 | 10.00% | 9 | 90.00% |
| 70+ | 2 | 0 | 0.00% | 2 | 100.00% |
The youngest and oldest candidate submitted
| Age | Institution | |
|---|---|---|
| Youngest | 19 | Rada Miejska w Żywcu |
| Oldest | 72 | Rada Powiatu w Żywcu |