Komitet Wyborczy Wyborców MIĘDZYGMINNE POROZUMIENIE SAMORZĄDOWE
| Name: | Komitet Wyborczy Wyborców MIĘDZYGMINNE POROZUMIENIE SAMORZĄDOWE | |
| Short name: | KWW MPS | |
| Type of committee: | Election committees established by electors | |
| Address: | ul. Karłowicza 4 p.303, 20-027 Lublin | |
| Plenipotentiary: | electoral | financial |
| Stefan Kowalewski | Anna Syroka- Bojarczyk | |
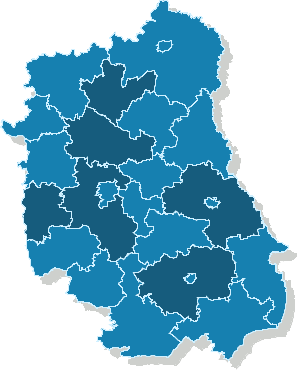
The provinces where the committee has submitted lists of candidates
| Name |
|---|
| pow. chełmski |
| pow. lubartowski |
| pow. lubelski |
| pow. opolski |
| pow. radzyński |
| pow. zamojski |
The statistics of election committe
Lists submitted
| Description | Number of |
|---|---|
| Number of lists submitted for province council | 0 |
| Number of lists submitted for county councils | 10 |
| Number of lists submitted for councils of cities holding county rights | 0 |
| Number of lists submitted for districts councils of the cap. city of Warsaw | 0 |
| Number of lists registered for communal councils | 38 |
| Totalling | 48 |
Submitted candidates
| Name | Number of candidates | Women | Women (%) | Men | Men (%) |
|---|---|---|---|---|---|
| Number of candidates submitted for the province council | 0 | 0 | - | 0 | - |
| Number of candidates submitted for county councils | 45 | 12 | 26.67% | 33 | 73.33% |
| Number of candidates submitted for councils of cities holding county rights | 0 | 0 | - | 0 | - |
| Number of candidates submitted for districts councils of the cap. city of Warsaw | 0 | 0 | - | 0 | - |
| Number of candidates registered for communal councils | 46 | 12 | 26.09% | 34 | 73.91% |
| Number of candidates submitted for reeve, mayor and presidential elections | 0 | 0 | - | 0 | - |
| Totalling | 91 | 24 | 26.37% | 67 | 73.63% |
Average age of submitted candidates
| Name | Average age | Average age of women | Average age of men |
|---|---|---|---|
| Average age of candidates submitted for the province council | - | - | - |
| Average age of candidates submitted for county councils | 45 | 42 | 46 |
| Average age of candidates for councils of cities holding county rights | - | - | - |
| Average age of candidates for districts councils of the cap. city of Warsaw | - | - | - |
| Average age of candidates submitted for communal councils | 41 | 41 | 41 |
| Average age of candidates for reeve, mayor, president | - | - | - |
| Totalling | 43 | 41 | 43 |
Submitted candidates grouped by age
| Name | Number of candidates | Women | Women (%) | Men | Men (%) |
|---|---|---|---|---|---|
| 18-29 | 8 | 2 | 25.00% | 6 | 75.00% |
| 30-39 | 27 | 9 | 33.33% | 18 | 66.67% |
| 40-49 | 27 | 6 | 22.22% | 21 | 77.78% |
| 50-59 | 22 | 7 | 31.82% | 15 | 68.18% |
| 60-69 | 6 | 0 | 0.00% | 6 | 100.00% |
| 70+ | 1 | 0 | 0.00% | 1 | 100.00% |
The youngest and oldest candidate submitted
| Age | Institution | |
|---|---|---|
| Youngest | 22 | Rada Gminy Chełm |
| Oldest | 72 | Rada Powiatu w Lublinie |