Komitet Wyborczy Wyborców Nasze Żuławy Mierzeja
| Name: | Komitet Wyborczy Wyborców Nasze Żuławy Mierzeja | |
| Short name: | KWW Nasze Żuławy Mierzeja | |
| Type of committee: | Election committees established by electors | |
| Address: | ul. Warszawska 48, 82-100 Nowy Dwór Gdański | |
| Plenipotentiary: | electoral | financial |
| Zbigniew Bojkowski | Dorota Henryka Burczik | |
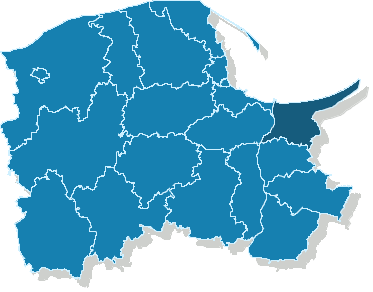
The provinces where the committee has submitted lists of candidates
| Name |
|---|
| pow. nowodworski |
The statistics of election committe
Lists submitted
| Description | Number of |
|---|---|
| Number of lists submitted for province council | 0 |
| Number of lists submitted for county councils | 2 |
| Number of lists submitted for councils of cities holding county rights | 0 |
| Number of lists submitted for districts councils of the cap. city of Warsaw | 0 |
| Number of lists registered for communal councils | 15 |
| Totalling | 17 |
Submitted candidates
| Name | Number of candidates | Women | Women (%) | Men | Men (%) |
|---|---|---|---|---|---|
| Number of candidates submitted for the province council | 0 | 0 | - | 0 | - |
| Number of candidates submitted for county councils | 23 | 12 | 52.17% | 11 | 47.83% |
| Number of candidates submitted for councils of cities holding county rights | 0 | 0 | - | 0 | - |
| Number of candidates submitted for districts councils of the cap. city of Warsaw | 0 | 0 | - | 0 | - |
| Number of candidates registered for communal councils | 22 | 13 | 59.09% | 9 | 40.91% |
| Number of candidates submitted for reeve, mayor and presidential elections | 2 | 2 | 100.00% | 0 | 0.00% |
| Totalling | 47 | 27 | 57.45% | 20 | 42.55% |
Average age of submitted candidates
| Name | Average age | Average age of women | Average age of men |
|---|---|---|---|
| Average age of candidates submitted for the province council | - | - | - |
| Average age of candidates submitted for county councils | 44 | 46 | 42 |
| Average age of candidates for councils of cities holding county rights | - | - | - |
| Average age of candidates for districts councils of the cap. city of Warsaw | - | - | - |
| Average age of candidates submitted for communal councils | 40 | 38 | 42 |
| Average age of candidates for reeve, mayor, president | 47 | 47 | - |
| Totalling | 42 | 42 | 42 |
Submitted candidates grouped by age
| Name | Number of candidates | Women | Women (%) | Men | Men (%) |
|---|---|---|---|---|---|
| 18-29 | 9 | 5 | 55.56% | 4 | 44.44% |
| 30-39 | 4 | 3 | 75.00% | 1 | 25.00% |
| 40-49 | 24 | 13 | 54.17% | 11 | 45.83% |
| 50-59 | 8 | 5 | 62.50% | 3 | 37.50% |
| 60-69 | 2 | 1 | 50.00% | 1 | 50.00% |
| 70+ | 0 | 0 | — | 0 | — |
The youngest and oldest candidate submitted
| Age | Institution | |
|---|---|---|
| Youngest | 19 | Rada Powiatu Nowodworskiego |
| Oldest | 67 | Rada Powiatu Nowodworskiego |