Komitet Wyborczy Ochotniczej Straży Pożarnej w Węgrach
| Name: | Komitet Wyborczy Ochotniczej Straży Pożarnej w Węgrach | |
| Short name: | KW OSP Węgry | |
| Type of committee: | Election committees established by organisations | |
| Address: | ul. Opolska 11A, Węgry, 46-023 Osowiec | |
| Plenipotentiary: | electoral | financial |
| Ewa Maria Pietras | Krystyna Wojnicka | |
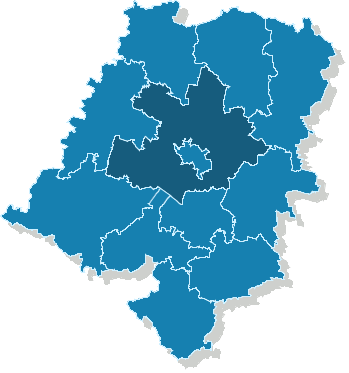
The provinces where the committee has submitted lists of candidates
| Name |
|---|
| pow. opolski |
The statistics of election committe
Lists submitted
| Description | Number of |
|---|---|
| Number of lists submitted for province council | 0 |
| Number of lists submitted for county councils | 0 |
| Number of lists submitted for councils of cities holding county rights | 0 |
| Number of lists submitted for districts councils of the cap. city of Warsaw | 0 |
| Number of lists registered for communal councils | 5 |
| Totalling | 5 |
Submitted candidates
| Name | Number of candidates | Women | Women (%) | Men | Men (%) |
|---|---|---|---|---|---|
| Number of candidates submitted for the province council | 0 | 0 | - | 0 | - |
| Number of candidates submitted for county councils | 0 | 0 | - | 0 | - |
| Number of candidates submitted for councils of cities holding county rights | 0 | 0 | - | 0 | - |
| Number of candidates submitted for districts councils of the cap. city of Warsaw | 0 | 0 | - | 0 | - |
| Number of candidates registered for communal councils | 9 | 1 | 11.11% | 8 | 88.89% |
| Number of candidates submitted for reeve, mayor and presidential elections | 1 | 0 | 0.00% | 1 | 100.00% |
| Totalling | 10 | 1 | 10.00% | 9 | 90.00% |
Average age of submitted candidates
| Name | Average age | Average age of women | Average age of men |
|---|---|---|---|
| Average age of candidates submitted for the province council | - | - | - |
| Average age of candidates submitted for county councils | - | - | - |
| Average age of candidates for councils of cities holding county rights | - | - | - |
| Average age of candidates for districts councils of the cap. city of Warsaw | - | - | - |
| Average age of candidates submitted for communal councils | 39 | 39 | 39 |
| Average age of candidates for reeve, mayor, president | 39 | - | 39 |
| Totalling | 39 | 39 | 39 |
Submitted candidates grouped by age
| Name | Number of candidates | Women | Women (%) | Men | Men (%) |
|---|---|---|---|---|---|
| 18-29 | 3 | 0 | 0.00% | 3 | 100.00% |
| 30-39 | 4 | 1 | 25.00% | 3 | 75.00% |
| 40-49 | 1 | 0 | 0.00% | 1 | 100.00% |
| 50-59 | 1 | 0 | 0.00% | 1 | 100.00% |
| 60-69 | 1 | 0 | 0.00% | 1 | 100.00% |
| 70+ | 0 | 0 | — | 0 | — |
The youngest and oldest candidate submitted
| Age | Institution | |
|---|---|---|
| Youngest | 25 | Rada Gminy Turawa |
| Oldest | 60 | Rada Gminy Turawa |