Komitet Wyborczy Demokratycznej Partii Lewicy
| Name: | Komitet Wyborczy Demokratycznej Partii Lewicy | |
| Short name: | KW DPL | |
| Type of committee: | Election committees established by political parties | |
| Address: | 46-100 Namysłów, Rynek-Ratusz | |
| Plenipotentiary: | electoral | financial |
| Tadeusz Jaroszewski | Barbara Wołkowicz | |
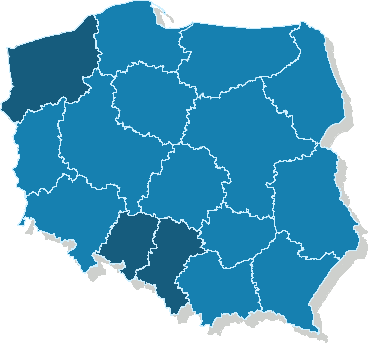
| Name |
|---|
| woj. opolskie |
| woj. śląskie |
| woj. zachodniopomorskie |
The statistics of election committe
Lists submitted
| Description | Number of |
|---|---|
| Number of lists submitted for province council | 0 |
| Number of lists submitted for county councils | 3 |
| Number of lists submitted for councils of cities holding county rights | 5 |
| Number of lists submitted for districts councils of the cap. city of Warsaw | 0 |
| Number of lists registered for communal councils | 18 |
| Totalling | 26 |
Submitted candidates
| Name | Number of candidates | Women | Women (%) | Men | Men (%) |
|---|---|---|---|---|---|
| Number of candidates submitted for the province council | 0 | 0 | - | 0 | - |
| Number of candidates submitted for county councils | 27 | 10 | 37.04% | 17 | 62.96% |
| Number of candidates submitted for councils of cities holding county rights | 47 | 15 | 31.91% | 32 | 68.09% |
| Number of candidates submitted for districts councils of the cap. city of Warsaw | 0 | 0 | - | 0 | - |
| Number of candidates registered for communal councils | 54 | 20 | 37.04% | 34 | 62.96% |
| Number of candidates submitted for reeve, mayor and presidential elections | 3 | 0 | 0.00% | 3 | 100.00% |
| Totalling | 131 | 45 | 34.35% | 86 | 65.65% |
Average age of submitted candidates
| Name | Average age | Average age of women | Average age of men |
|---|---|---|---|
| Average age of candidates submitted for the province council | - | - | - |
| Average age of candidates submitted for county councils | 42 | 43 | 42 |
| Average age of candidates for councils of cities holding county rights | 47 | 40 | 51 |
| Average age of candidates for districts councils of the cap. city of Warsaw | - | - | - |
| Average age of candidates submitted for communal councils | 45 | 43 | 47 |
| Average age of candidates for reeve, mayor, president | 53 | - | 53 |
| Totalling | 45 | 42 | 47 |
Submitted candidates grouped by age
| Name | Number of candidates | Women | Women (%) | Men | Men (%) |
|---|---|---|---|---|---|
| 18-29 | 20 | 9 | 45.00% | 11 | 55.00% |
| 30-39 | 21 | 8 | 38.10% | 13 | 61.90% |
| 40-49 | 31 | 13 | 41.94% | 18 | 58.06% |
| 50-59 | 42 | 15 | 35.71% | 27 | 64.29% |
| 60-69 | 15 | 0 | 0.00% | 15 | 100.00% |
| 70+ | 2 | 0 | 0.00% | 2 | 100.00% |
The youngest and oldest candidate submitted
| Age | Institution | |
|---|---|---|
| Youngest | 19 | Rada Miejska w Dąbrowie Górniczej |
| Oldest | 77 | Rada Miejska w Dąbrowie Górniczej |