Komitet Wyborczy Wyborców Powiatu Hrubieszowskiego
| Name: | Komitet Wyborczy Wyborców Powiatu Hrubieszowskiego | |
| Short name: | KWW Powiatu Hrubieszowskiego | |
| Type of committee: | Election committees established by electors | |
| Address: | Ludna 22/21, 22-500 Hrubieszów | |
| Plenipotentiary: | electoral | financial |
| Tomasz Robert Pańko | Rafał Fedaczyński | |
The provinces where the committee has submitted lists of candidates
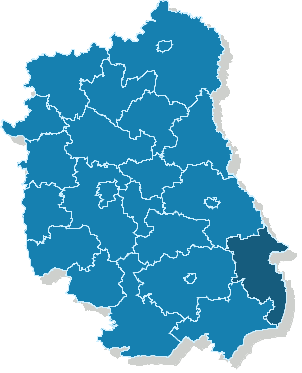
| Name |
|---|
| pow. hrubieszowski |
The statistics of election committe
Lists submitted
| Description | Number of |
|---|---|
| Number of lists submitted for province council | 0 |
| Number of lists submitted for county councils | 5 |
| Number of lists submitted for councils of cities holding county rights | 0 |
| Number of lists submitted for districts councils of the cap. city of Warsaw | 0 |
| Number of lists registered for communal councils | 22 |
| Totalling | 27 |
Submitted candidates
| Name | Number of candidates | Women | Women (%) | Men | Men (%) |
|---|---|---|---|---|---|
| Number of candidates submitted for the province council | 0 | 0 | - | 0 | - |
| Number of candidates submitted for county councils | 32 | 10 | 31.25% | 22 | 68.75% |
| Number of candidates submitted for councils of cities holding county rights | 0 | 0 | - | 0 | - |
| Number of candidates submitted for districts councils of the cap. city of Warsaw | 0 | 0 | - | 0 | - |
| Number of candidates registered for communal councils | 24 | 5 | 20.83% | 19 | 79.17% |
| Number of candidates submitted for reeve, mayor and presidential elections | 2 | 1 | 50.00% | 1 | 50.00% |
| Totalling | 58 | 16 | 27.59% | 42 | 72.41% |
Average age of submitted candidates
| Name | Average age | Average age of women | Average age of men |
|---|---|---|---|
| Average age of candidates submitted for the province council | - | - | - |
| Average age of candidates submitted for county councils | 43 | 43 | 43 |
| Average age of candidates for councils of cities holding county rights | - | - | - |
| Average age of candidates for districts councils of the cap. city of Warsaw | - | - | - |
| Average age of candidates submitted for communal councils | 40 | 35 | 41 |
| Average age of candidates for reeve, mayor, president | 41 | 51 | 32 |
| Totalling | 42 | 41 | 42 |
Submitted candidates grouped by age
| Name | Number of candidates | Women | Women (%) | Men | Men (%) |
|---|---|---|---|---|---|
| 18-29 | 7 | 3 | 42.86% | 4 | 57.14% |
| 30-39 | 16 | 4 | 25.00% | 12 | 75.00% |
| 40-49 | 20 | 4 | 20.00% | 16 | 80.00% |
| 50-59 | 13 | 5 | 38.46% | 8 | 61.54% |
| 60-69 | 2 | 0 | 0.00% | 2 | 100.00% |
| 70+ | 0 | 0 | — | 0 | — |
The youngest and oldest candidate submitted
| Age | Institution | |
|---|---|---|
| Youngest | 20 | Rada Gminy Hrubieszów |
| Oldest | 64 | Rada Powiatu Hrubieszowskiego |