Komitet Wyborczy Wyborców Obywatelski Blok Samorządowy
| Name: | Komitet Wyborczy Wyborców Obywatelski Blok Samorządowy | |
| Short name: | KWW OBYWATELSKI BLOK SAMORZĄDOWY | |
| Type of committee: | Election committees established by electors | |
| Address: | ul. Kościuszki 12/17, 87-600 Lipno | |
| Plenipotentiary: | electoral | financial |
| Zbigniew Chmielewski | Zdzisław Zygmunt Koszczka | |
The provinces where the committee has submitted lists of candidates
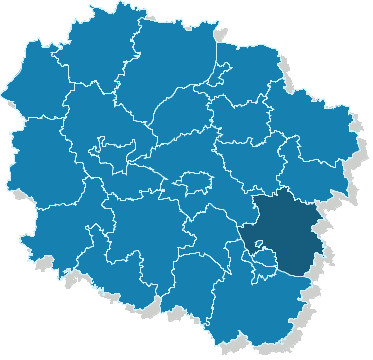
| Name |
|---|
| pow. lipnowski |
The statistics of election committe
Lists submitted
| Description | Number of |
|---|---|
| Number of lists submitted for province council | 0 |
| Number of lists submitted for county councils | 3 |
| Number of lists submitted for councils of cities holding county rights | 0 |
| Number of lists submitted for districts councils of the cap. city of Warsaw | 0 |
| Number of lists registered for communal councils | 11 |
| Totalling | 14 |
Submitted candidates
| Name | Number of candidates | Women | Women (%) | Men | Men (%) |
|---|---|---|---|---|---|
| Number of candidates submitted for the province council | 0 | 0 | - | 0 | - |
| Number of candidates submitted for county councils | 15 | 4 | 26.67% | 11 | 73.33% |
| Number of candidates submitted for councils of cities holding county rights | 0 | 0 | - | 0 | - |
| Number of candidates submitted for districts councils of the cap. city of Warsaw | 0 | 0 | - | 0 | - |
| Number of candidates registered for communal councils | 20 | 4 | 20.00% | 16 | 80.00% |
| Number of candidates submitted for reeve, mayor and presidential elections | 1 | 0 | 0.00% | 1 | 100.00% |
| Totalling | 36 | 8 | 22.22% | 28 | 77.78% |
Average age of submitted candidates
| Name | Average age | Average age of women | Average age of men |
|---|---|---|---|
| Average age of candidates submitted for the province council | - | - | - |
| Average age of candidates submitted for county councils | 48 | 50 | 47 |
| Average age of candidates for councils of cities holding county rights | - | - | - |
| Average age of candidates for districts councils of the cap. city of Warsaw | - | - | - |
| Average age of candidates submitted for communal councils | 43 | 50 | 41 |
| Average age of candidates for reeve, mayor, president | 48 | - | 48 |
| Totalling | 45 | 50 | 44 |
Submitted candidates grouped by age
| Name | Number of candidates | Women | Women (%) | Men | Men (%) |
|---|---|---|---|---|---|
| 18-29 | 4 | 0 | 0.00% | 4 | 100.00% |
| 30-39 | 7 | 0 | 0.00% | 7 | 100.00% |
| 40-49 | 10 | 4 | 40.00% | 6 | 60.00% |
| 50-59 | 13 | 4 | 30.77% | 9 | 69.23% |
| 60-69 | 2 | 0 | 0.00% | 2 | 100.00% |
| 70+ | 0 | 0 | — | 0 | — |
The youngest and oldest candidate submitted
| Age | Institution | |
|---|---|---|
| Youngest | 25 | Rada Powiatu w Lipnie |
| Oldest | 68 | Rada Powiatu w Lipnie |