Komitet Wyborczy Ponadpartyjne Forum Samorządowe
| Name: | Komitet Wyborczy Ponadpartyjne Forum Samorządowe | |
| Short name: | KW Ponadpartyjne Forum Samorządowe | |
| Type of committee: | Election committees established by organisations | |
| Address: | ul. Piastowska 41, 58-260 Bielawa | |
| Plenipotentiary: | electoral | financial |
| Wiesław Kaptur | Benedykta Koczur | |
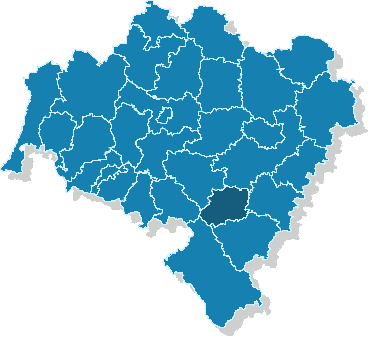
The provinces where the committee has submitted lists of candidates
| Name |
|---|
| pow. dzierżoniowski |
The statistics of election committe
Lists submitted
| Description | Number of |
|---|---|
| Number of lists submitted for province council | 0 |
| Number of lists submitted for county councils | 4 |
| Number of lists submitted for councils of cities holding county rights | 0 |
| Number of lists submitted for districts councils of the cap. city of Warsaw | 0 |
| Number of lists registered for communal councils | 4 |
| Totalling | 8 |
Submitted candidates
| Name | Number of candidates | Women | Women (%) | Men | Men (%) |
|---|---|---|---|---|---|
| Number of candidates submitted for the province council | 0 | 0 | - | 0 | - |
| Number of candidates submitted for county councils | 34 | 10 | 29.41% | 24 | 70.59% |
| Number of candidates submitted for councils of cities holding county rights | 0 | 0 | - | 0 | - |
| Number of candidates submitted for districts councils of the cap. city of Warsaw | 0 | 0 | - | 0 | - |
| Number of candidates registered for communal councils | 42 | 15 | 35.71% | 27 | 64.29% |
| Number of candidates submitted for reeve, mayor and presidential elections | 1 | 0 | 0.00% | 1 | 100.00% |
| Totalling | 77 | 25 | 32.47% | 52 | 67.53% |
Average age of submitted candidates
| Name | Average age | Average age of women | Average age of men |
|---|---|---|---|
| Average age of candidates submitted for the province council | - | - | - |
| Average age of candidates submitted for county councils | 45 | 45 | 45 |
| Average age of candidates for councils of cities holding county rights | - | - | - |
| Average age of candidates for districts councils of the cap. city of Warsaw | - | - | - |
| Average age of candidates submitted for communal councils | 48 | 46 | 50 |
| Average age of candidates for reeve, mayor, president | 54 | - | 54 |
| Totalling | 47 | 46 | 48 |
Submitted candidates grouped by age
| Name | Number of candidates | Women | Women (%) | Men | Men (%) |
|---|---|---|---|---|---|
| 18-29 | 5 | 1 | 20.00% | 4 | 80.00% |
| 30-39 | 12 | 3 | 25.00% | 9 | 75.00% |
| 40-49 | 20 | 10 | 50.00% | 10 | 50.00% |
| 50-59 | 32 | 10 | 31.25% | 22 | 68.75% |
| 60-69 | 8 | 1 | 12.50% | 7 | 87.50% |
| 70+ | 0 | 0 | — | 0 | — |
The youngest and oldest candidate submitted
| Age | Institution | |
|---|---|---|
| Youngest | 20 | Rada Powiatu Dzierżoniowskiego |
| Oldest | 69 | Rada Miejska Bielawy |