Komitet Wyborczy TOWARZYSTWO SAMORZĄDOWE
| Name: | Komitet Wyborczy TOWARZYSTWO SAMORZĄDOWE | |
| Short name: | KW TOWARZYSTWO SAMORZĄDOWE | |
| Type of committee: | Election committees established by organisations | |
| Address: | Zofii Urbanowskiej 8, 62-500, Konin | |
| Plenipotentiary: | electoral | financial |
| Ireneusz Niewiarowski | Waldemar Józef Tubacki | |
The provinces where the committee has submitted lists of candidates
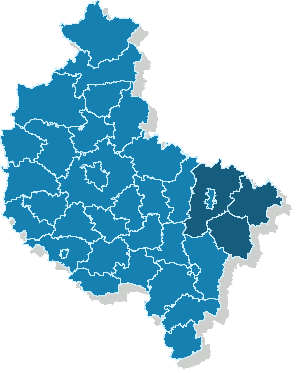
| Name |
|---|
| pow. kolski |
| pow. koniński |
| pow. turecki |
The statistics of election committe
Lists submitted
| Description | Number of |
|---|---|
| Number of lists submitted for province council | 0 |
| Number of lists submitted for county councils | 16 |
| Number of lists submitted for councils of cities holding county rights | 0 |
| Number of lists submitted for districts councils of the cap. city of Warsaw | 0 |
| Number of lists registered for communal councils | 112 |
| Totalling | 128 |
Submitted candidates
| Name | Number of candidates | Women | Women (%) | Men | Men (%) |
|---|---|---|---|---|---|
| Number of candidates submitted for the province council | 0 | 0 | - | 0 | - |
| Number of candidates submitted for county councils | 117 | 29 | 24.79% | 88 | 75.21% |
| Number of candidates submitted for councils of cities holding county rights | 0 | 0 | - | 0 | - |
| Number of candidates submitted for districts councils of the cap. city of Warsaw | 0 | 0 | - | 0 | - |
| Number of candidates registered for communal councils | 202 | 53 | 26.24% | 149 | 73.76% |
| Number of candidates submitted for reeve, mayor and presidential elections | 10 | 0 | 0.00% | 10 | 100.00% |
| Totalling | 329 | 82 | 24.92% | 247 | 75.08% |
Average age of submitted candidates
| Name | Average age | Average age of women | Average age of men |
|---|---|---|---|
| Average age of candidates submitted for the province council | - | - | - |
| Average age of candidates submitted for county councils | 46 | 44 | 47 |
| Average age of candidates for councils of cities holding county rights | - | - | - |
| Average age of candidates for districts councils of the cap. city of Warsaw | - | - | - |
| Average age of candidates submitted for communal councils | 45 | 44 | 45 |
| Average age of candidates for reeve, mayor, president | 50 | - | 50 |
| Totalling | 45 | 44 | 46 |
Submitted candidates grouped by age
| Name | Number of candidates | Women | Women (%) | Men | Men (%) |
|---|---|---|---|---|---|
| 18-29 | 28 | 8 | 28.57% | 20 | 71.43% |
| 30-39 | 53 | 13 | 24.53% | 40 | 75.47% |
| 40-49 | 122 | 32 | 26.23% | 90 | 73.77% |
| 50-59 | 100 | 27 | 27.00% | 73 | 73.00% |
| 60-69 | 22 | 2 | 9.09% | 20 | 90.91% |
| 70+ | 4 | 0 | 0.00% | 4 | 100.00% |
The youngest and oldest candidate submitted
| Age | Institution | |
|---|---|---|
| Youngest | 21 | Rada Powiatu Konińskiego |
| Oldest | 76 | Rada Powiatu Tureckiego |