Komitet Wyborczy Wyborców Porozumienie Obywatelskie Samorządność Kociewia
| Name: | Komitet Wyborczy Wyborców Porozumienie Obywatelskie Samorządność Kociewia | |
| Short name: | KWW PO SAMORZĄDNOŚĆ KOCIEWIA | |
| Type of committee: | Election committees established by electors | |
| Address: | ul. Hallera 21B, 83-200 Starogard Gdański | |
| Plenipotentiary: | electoral | financial |
| Wiesław Bogusław Warchoł | Andrzej Wiesław Pograniczny | |
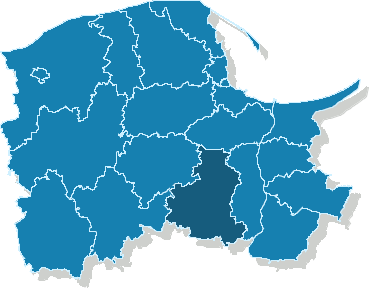
The provinces where the committee has submitted lists of candidates
| Name |
|---|
| pow. starogardzki |
The statistics of election committe
Lists submitted
| Description | Number of |
|---|---|
| Number of lists submitted for province council | 0 |
| Number of lists submitted for county councils | 0 |
| Number of lists submitted for councils of cities holding county rights | 0 |
| Number of lists submitted for districts councils of the cap. city of Warsaw | 0 |
| Number of lists registered for communal councils | 39 |
| Totalling | 39 |
Submitted candidates
| Name | Number of candidates | Women | Women (%) | Men | Men (%) |
|---|---|---|---|---|---|
| Number of candidates submitted for the province council | 0 | 0 | - | 0 | - |
| Number of candidates submitted for county councils | 0 | 0 | - | 0 | - |
| Number of candidates submitted for councils of cities holding county rights | 0 | 0 | - | 0 | - |
| Number of candidates submitted for districts councils of the cap. city of Warsaw | 0 | 0 | - | 0 | - |
| Number of candidates registered for communal councils | 65 | 17 | 26.15% | 48 | 73.85% |
| Number of candidates submitted for reeve, mayor and presidential elections | 5 | 1 | 20.00% | 4 | 80.00% |
| Totalling | 70 | 18 | 25.71% | 52 | 74.29% |
Average age of submitted candidates
| Name | Average age | Average age of women | Average age of men |
|---|---|---|---|
| Average age of candidates submitted for the province council | - | - | - |
| Average age of candidates submitted for county councils | - | - | - |
| Average age of candidates for councils of cities holding county rights | - | - | - |
| Average age of candidates for districts councils of the cap. city of Warsaw | - | - | - |
| Average age of candidates submitted for communal councils | 43 | 43 | 43 |
| Average age of candidates for reeve, mayor, president | 46 | 51 | 44 |
| Totalling | 43 | 43 | 43 |
Submitted candidates grouped by age
| Name | Number of candidates | Women | Women (%) | Men | Men (%) |
|---|---|---|---|---|---|
| 18-29 | 6 | 2 | 33.33% | 4 | 66.67% |
| 30-39 | 20 | 5 | 25.00% | 15 | 75.00% |
| 40-49 | 23 | 5 | 21.74% | 18 | 78.26% |
| 50-59 | 17 | 5 | 29.41% | 12 | 70.59% |
| 60-69 | 4 | 1 | 25.00% | 3 | 75.00% |
| 70+ | 0 | 0 | — | 0 | — |
The youngest and oldest candidate submitted
| Age | Institution | |
|---|---|---|
| Youngest | 26 | Rada Gminy Lubichowo |
| Oldest | 68 | Rada Gminy Smętowo Graniczne |