Komitet Wyborczy Wyborców BEZPARTYJNY BLOK SAMORZĄDOWY
| Name: | Komitet Wyborczy Wyborców BEZPARTYJNY BLOK SAMORZĄDOWY | |
| Short name: | KWW BEZPARTYJNY BLOK SAMORZĄDOWY | |
| Type of committee: | Election committees established by electors | |
| Address: | ul. Paderewskiego 17/4, 55-200 Oława | |
| Plenipotentiary: | electoral | financial |
| Tomasz Jasiński | Jarosław Hadryś | |
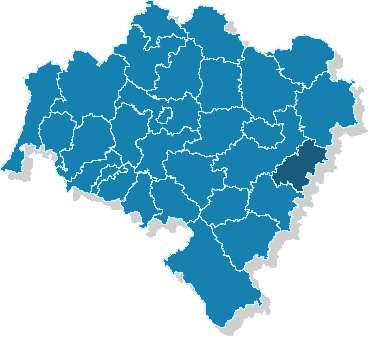
The provinces where the committee has submitted lists of candidates
| Name |
|---|
| pow. oławski |
The statistics of election committe
Lists submitted
| Description | Number of |
|---|---|
| Number of lists submitted for province council | 0 |
| Number of lists submitted for county councils | 2 |
| Number of lists submitted for councils of cities holding county rights | 0 |
| Number of lists submitted for districts councils of the cap. city of Warsaw | 0 |
| Number of lists registered for communal councils | 3 |
| Totalling | 5 |
Submitted candidates
| Name | Number of candidates | Women | Women (%) | Men | Men (%) |
|---|---|---|---|---|---|
| Number of candidates submitted for the province council | 0 | 0 | - | 0 | - |
| Number of candidates submitted for county councils | 26 | 13 | 50.00% | 13 | 50.00% |
| Number of candidates submitted for councils of cities holding county rights | 0 | 0 | - | 0 | - |
| Number of candidates submitted for districts councils of the cap. city of Warsaw | 0 | 0 | - | 0 | - |
| Number of candidates registered for communal councils | 42 | 14 | 33.33% | 28 | 66.67% |
| Number of candidates submitted for reeve, mayor and presidential elections | 1 | 0 | 0.00% | 1 | 100.00% |
| Totalling | 69 | 27 | 39.13% | 42 | 60.87% |
Average age of submitted candidates
| Name | Average age | Average age of women | Average age of men |
|---|---|---|---|
| Average age of candidates submitted for the province council | - | - | - |
| Average age of candidates submitted for county councils | 50 | 48 | 51 |
| Average age of candidates for councils of cities holding county rights | - | - | - |
| Average age of candidates for districts councils of the cap. city of Warsaw | - | - | - |
| Average age of candidates submitted for communal councils | 46 | 48 | 45 |
| Average age of candidates for reeve, mayor, president | 56 | - | 56 |
| Totalling | 47 | 48 | 47 |
Submitted candidates grouped by age
| Name | Number of candidates | Women | Women (%) | Men | Men (%) |
|---|---|---|---|---|---|
| 18-29 | 3 | 1 | 33.33% | 2 | 66.67% |
| 30-39 | 13 | 2 | 15.38% | 11 | 84.62% |
| 40-49 | 23 | 13 | 56.52% | 10 | 43.48% |
| 50-59 | 19 | 6 | 31.58% | 13 | 68.42% |
| 60-69 | 11 | 5 | 45.45% | 6 | 54.55% |
| 70+ | 0 | 0 | — | 0 | — |
The youngest and oldest candidate submitted
| Age | Institution | |
|---|---|---|
| Youngest | 26 | Rada Miejska w Oławie |
| Oldest | 68 | Rada Powiatu Oławskiego |