Komitet Wyborczy Wyborców STALOWA WOLA NAPRZÓD
| Name: | Komitet Wyborczy Wyborców STALOWA WOLA NAPRZÓD | |
| Short name: | KWW STALOWA WOLA NAPRZÓD | |
| Type of committee: | Election committees established by electors | |
| Address: | ul. Podleśna 15, 37-450 Stalowa Wola | |
| Plenipotentiary: | electoral | financial |
| Zbigniew Sowa | Romuald Jan Chagowski | |
The provinces where the committee has submitted lists of candidates
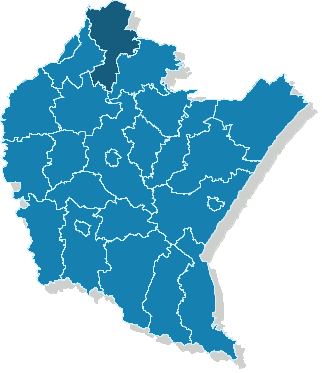
| Name |
|---|
| pow. stalowowolski |
The statistics of election committe
Lists submitted
| Description | Number of |
|---|---|
| Number of lists submitted for province council | 0 |
| Number of lists submitted for county councils | 4 |
| Number of lists submitted for councils of cities holding county rights | 0 |
| Number of lists submitted for districts councils of the cap. city of Warsaw | 0 |
| Number of lists registered for communal councils | 14 |
| Totalling | 18 |
Submitted candidates
| Name | Number of candidates | Women | Women (%) | Men | Men (%) |
|---|---|---|---|---|---|
| Number of candidates submitted for the province council | 0 | 0 | - | 0 | - |
| Number of candidates submitted for county councils | 46 | 8 | 17.39% | 38 | 82.61% |
| Number of candidates submitted for councils of cities holding county rights | 0 | 0 | - | 0 | - |
| Number of candidates submitted for districts councils of the cap. city of Warsaw | 0 | 0 | - | 0 | - |
| Number of candidates registered for communal councils | 65 | 15 | 23.08% | 50 | 76.92% |
| Number of candidates submitted for reeve, mayor and presidential elections | 2 | 0 | 0.00% | 2 | 100.00% |
| Totalling | 113 | 23 | 20.35% | 90 | 79.65% |
Average age of submitted candidates
| Name | Average age | Average age of women | Average age of men |
|---|---|---|---|
| Average age of candidates submitted for the province council | - | - | - |
| Average age of candidates submitted for county councils | 44 | 41 | 45 |
| Average age of candidates for councils of cities holding county rights | - | - | - |
| Average age of candidates for districts councils of the cap. city of Warsaw | - | - | - |
| Average age of candidates submitted for communal councils | 43 | 46 | 42 |
| Average age of candidates for reeve, mayor, president | 60 | - | 60 |
| Totalling | 44 | 44 | 44 |
Submitted candidates grouped by age
| Name | Number of candidates | Women | Women (%) | Men | Men (%) |
|---|---|---|---|---|---|
| 18-29 | 19 | 3 | 15.79% | 16 | 84.21% |
| 30-39 | 21 | 4 | 19.05% | 17 | 80.95% |
| 40-49 | 31 | 10 | 32.26% | 21 | 67.74% |
| 50-59 | 28 | 3 | 10.71% | 25 | 89.29% |
| 60-69 | 13 | 2 | 15.38% | 11 | 84.62% |
| 70+ | 1 | 1 | 100.00% | 0 | 0.00% |
The youngest and oldest candidate submitted
| Age | Institution | |
|---|---|---|
| Youngest | 19 | Rada Miejska w Stalowej Woli |
| Oldest | 72 | Rada Miejska w Stalowej Woli |