Komitet Wyborczy Wyborców Ruch Ludowo-Narodowy
| Name: | Komitet Wyborczy Wyborców Ruch Ludowo-Narodowy | |
| Short name: | KWW Ruch Ludowo-Narodowy | |
| Type of committee: | Election committees established by electors | |
| Address: | ul. Powązkowska 44b, 01-797 Warszawa | |
| Plenipotentiary: | electoral | financial |
| Jan Bestry | Gerard Radosław Gajewski | |
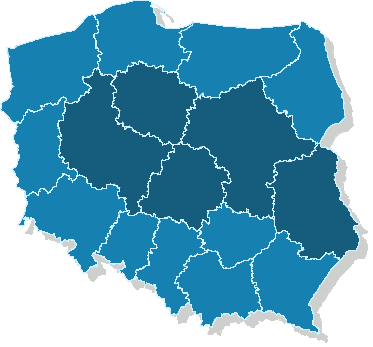
| Name |
|---|
| woj. kujawsko-pomorskie |
| woj. lubelskie |
| woj. łódzkie |
| woj. mazowieckie |
| woj. wielkopolskie |
The statistics of election committe
Lists submitted
| Description | Number of |
|---|---|
| Number of lists submitted for province council | 0 |
| Number of lists submitted for county councils | 1 |
| Number of lists submitted for councils of cities holding county rights | 8 |
| Number of lists submitted for districts councils of the cap. city of Warsaw | 0 |
| Number of lists registered for communal councils | 22 |
| Totalling | 31 |
Submitted candidates
| Name | Number of candidates | Women | Women (%) | Men | Men (%) |
|---|---|---|---|---|---|
| Number of candidates submitted for the province council | 0 | 0 | - | 0 | - |
| Number of candidates submitted for county councils | 3 | 2 | 66.67% | 1 | 33.33% |
| Number of candidates submitted for councils of cities holding county rights | 49 | 22 | 44.90% | 27 | 55.10% |
| Number of candidates submitted for districts councils of the cap. city of Warsaw | 0 | 0 | - | 0 | - |
| Number of candidates registered for communal councils | 22 | 9 | 40.91% | 13 | 59.09% |
| Number of candidates submitted for reeve, mayor and presidential elections | 1 | 0 | 0.00% | 1 | 100.00% |
| Totalling | 75 | 33 | 44.00% | 42 | 56.00% |
Average age of submitted candidates
| Name | Average age | Average age of women | Average age of men |
|---|---|---|---|
| Average age of candidates submitted for the province council | - | - | - |
| Average age of candidates submitted for county councils | 44 | 40 | 53 |
| Average age of candidates for councils of cities holding county rights | 41 | 41 | 40 |
| Average age of candidates for districts councils of the cap. city of Warsaw | - | - | - |
| Average age of candidates submitted for communal councils | 36 | 40 | 33 |
| Average age of candidates for reeve, mayor, president | 41 | - | 41 |
| Totalling | 40 | 41 | 38 |
Submitted candidates grouped by age
| Name | Number of candidates | Women | Women (%) | Men | Men (%) |
|---|---|---|---|---|---|
| 18-29 | 17 | 7 | 41.18% | 10 | 58.82% |
| 30-39 | 20 | 9 | 45.00% | 11 | 55.00% |
| 40-49 | 19 | 5 | 26.32% | 14 | 73.68% |
| 50-59 | 15 | 10 | 66.67% | 5 | 33.33% |
| 60-69 | 4 | 2 | 50.00% | 2 | 50.00% |
| 70+ | 0 | 0 | — | 0 | — |
The youngest and oldest candidate submitted
| Age | Institution | |
|---|---|---|
| Youngest | 19 | Rada Miejska w Łodzi |
| Oldest | 63 | Rada Miejska w Łodzi |