Komitet Wyborczy Prawo i Sprawiedliwość
| Name: | Komitet Wyborczy Prawo i Sprawiedliwość | |
| Short name: | KW Prawo i Sprawiedliwość | |
| Type of committee: | Election committees established by political parties | |
| Address: | ul. Nowogrodzka 84/86, 02-018 Warszawa | |
| Plenipotentiary: | electoral | financial |
| Tomasz Karusewicz | Teresa Kostrzewska-Gorczyca | |
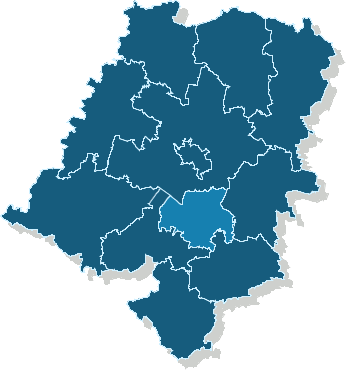
The provinces where the committee has submitted lists of candidates

| Name |
|---|
| m. Opole |
| pow. brzeski |
| pow. głubczycki |
| pow. kędzierzyńsko-kozielski |
| pow. kluczborski |
| pow. namysłowski |
| pow. nyski |
| pow. oleski |
| pow. opolski |
| pow. prudnicki |
| pow. strzelecki |
Sejmik Województwa Opolskiego
Submitted candidates
| Name | Number of candidates | Women | Women (%) | Men | Men (%) | Status |
|---|---|---|---|---|---|---|
| Sum: | 40 | 10 | 25.00% | 30 | 75.00% | |
| Constituency no. 1 | 9 | 3 | 33.33% | 6 | 66.67% |
|
| Constituency no. 2 | 7 | 1 | 14.29% | 6 | 85.71% |
|
| Constituency no. 3 | 7 | 2 | 28.57% | 5 | 71.43% |
|
| Constituency no. 4 | 8 | 3 | 37.50% | 5 | 62.50% |
|
| Constituency no. 5 | 9 | 1 | 11.11% | 8 | 88.89% |
|
Age of the candidates
| Name | Average age | Average age of women | Average age of men | Oldest | Youngest |
|---|---|---|---|---|---|
| Constituency no. 1 | 42 | 47 | 39 | 56 | 24 |
| Constituency no. 2 | 50 | 42 | 52 | 61 | 42 |
| Constituency no. 3 | 45 | 46 | 45 | 57 | 37 |
| Constituency no. 4 | 48 | 54 | 44 | 57 | 20 |
| Constituency no. 5 | 50 | 44 | 51 | 65 | 40 |
The statistics of election committe
Lists submitted
| Description | Number of |
|---|---|
| Number of lists submitted for province council | 5 |
| Number of lists submitted for county councils | 34 |
| Number of lists submitted for councils of cities holding county rights | 5 |
| Number of lists registered for communal councils | 133 |
| Totalling | 177 |
Submitted candidates
| Name | Number of candidates | Women | Women (%) | Men | Men (%) |
|---|---|---|---|---|---|
| Number of candidates submitted for the province council | 40 | 10 | 25.00% | 30 | 75.00% |
| Number of candidates submitted for county councils | 224 | 57 | 25.45% | 167 | 74.55% |
| Number of candidates submitted for councils of cities holding county rights | 33 | 12 | 36.36% | 21 | 63.64% |
| Number of candidates registered for communal councils | 387 | 138 | 35.66% | 249 | 64.34% |
| Number of candidates submitted for reeve, mayor and presidential elections | 19 | 2 | 10.53% | 17 | 89.47% |
| Totalling | 703 | 219 | 31.15% | 484 | 68.85% |
Average age of submitted candidates
| Name | Average age | Average age of women | Average age of men |
|---|---|---|---|
| Average age of candidates submitted for the province council | 47 | 48 | 47 |
| Average age of candidates submitted for county councils | 44 | 45 | 43 |
| Average age of candidates for councils of cities holding county rights | 45 | 47 | 44 |
| Average age of candidates submitted for communal councils | 44 | 42 | 46 |
| Average age of candidates for reeve, mayor, president | 44 | 54 | 43 |
| Totalling | 44 | 44 | 45 |
Submitted candidates grouped by age
| Name | Number of candidates | Women | Women (%) | Men | Men (%) |
|---|---|---|---|---|---|
| 18-29 | 83 | 18 | 21.69% | 65 | 78.31% |
| 30-39 | 145 | 56 | 38.62% | 89 | 61.38% |
| 40-49 | 209 | 70 | 33.49% | 139 | 66.51% |
| 50-59 | 196 | 58 | 29.59% | 138 | 70.41% |
| 60-69 | 63 | 15 | 23.81% | 48 | 76.19% |
| 70+ | 7 | 2 | 28.57% | 5 | 71.43% |
The youngest and oldest candidate submitted
| Age | Institution | |
|---|---|---|
| Youngest | 18 | Rada Miejska w Kluczborku |
| Oldest | 86 | Rada Powiatu w Nysie |