Komitet Wyborczy Wyborców WOJEWÓDZKI RUCH SAMORZĄDOWY
| Name: | Komitet Wyborczy Wyborców WOJEWÓDZKI RUCH SAMORZĄDOWY | |
| Short name: | KWW WRS | |
| Type of committee: | Election committees established by electors | |
| Address: | ul. Jaracza 55 m. 21, 90-251 Łódź | |
| Plenipotentiary: | electoral | financial |
| Mirosław Łukasz Wnuk | Stefan Świerczyński | |
The provinces where the committee has submitted lists of candidates
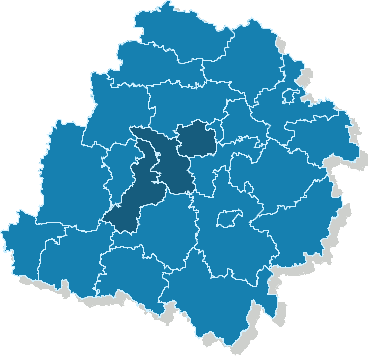
| Name |
|---|
| m. Łódź |
| pow. łaski |
| pow. pabianicki |
Sejmik Województwa Łódzkiego
Submitted candidates
| Name | Number of candidates | Women | Women (%) | Men | Men (%) | Status |
|---|---|---|---|---|---|---|
| Sum: | 18 | 6 | 33.33% | 12 | 66.67% | |
| Constituency no. 1 | 5 | 1 | 20.00% | 4 | 80.00% |
|
| Constituency no. 2 | 6 | 4 | 66.67% | 2 | 33.33% |
|
| Constituency no. 4 | 7 | 1 | 14.29% | 6 | 85.71% |
|
Age of the candidates
| Name | Average age | Average age of women | Average age of men | Oldest | Youngest |
|---|---|---|---|---|---|
| Constituency no. 1 | 53 | 42 | 55 | 58 | 42 |
| Constituency no. 2 | 42 | 42 | 43 | 53 | 22 |
| Constituency no. 4 | 48 | 50 | 48 | 74 | 25 |
The statistics of election committe
Lists submitted
| Description | Number of |
|---|---|
| Number of lists submitted for province council | 3 |
| Number of lists submitted for county councils | 5 |
| Number of lists submitted for councils of cities holding county rights | 8 |
| Number of lists submitted for districts councils of the cap. city of Warsaw | 0 |
| Number of lists registered for communal councils | 17 |
| Totalling | 33 |
Submitted candidates
| Name | Number of candidates | Women | Women (%) | Men | Men (%) |
|---|---|---|---|---|---|
| Number of candidates submitted for the province council | 18 | 6 | 33.33% | 12 | 66.67% |
| Number of candidates submitted for county councils | 24 | 12 | 50.00% | 12 | 50.00% |
| Number of candidates submitted for councils of cities holding county rights | 51 | 21 | 41.18% | 30 | 58.82% |
| Number of candidates submitted for districts councils of the cap. city of Warsaw | 0 | 0 | - | 0 | - |
| Number of candidates registered for communal councils | 41 | 19 | 46.34% | 22 | 53.66% |
| Number of candidates submitted for reeve, mayor and presidential elections | 3 | 1 | 33.33% | 2 | 66.67% |
| Totalling | 137 | 59 | 43.07% | 78 | 56.93% |
Average age of submitted candidates
| Name | Average age | Average age of women | Average age of men |
|---|---|---|---|
| Average age of candidates submitted for the province council | 47 | 43 | 49 |
| Average age of candidates submitted for county councils | 36 | 33 | 39 |
| Average age of candidates for councils of cities holding county rights | 46 | 44 | 47 |
| Average age of candidates for districts councils of the cap. city of Warsaw | - | - | - |
| Average age of candidates submitted for communal councils | 35 | 38 | 32 |
| Average age of candidates for reeve, mayor, president | 46 | 53 | 43 |
| Totalling | 41 | 40 | 42 |
Submitted candidates grouped by age
| Name | Number of candidates | Women | Women (%) | Men | Men (%) |
|---|---|---|---|---|---|
| 18-29 | 25 | 11 | 44.00% | 14 | 56.00% |
| 30-39 | 44 | 21 | 47.73% | 23 | 52.27% |
| 40-49 | 30 | 14 | 46.67% | 16 | 53.33% |
| 50-59 | 24 | 8 | 33.33% | 16 | 66.67% |
| 60-69 | 9 | 3 | 33.33% | 6 | 66.67% |
| 70+ | 5 | 2 | 40.00% | 3 | 60.00% |
The youngest and oldest candidate submitted
| Age | Institution | |
|---|---|---|
| Youngest | 20 | Rada Miejska w Pabianicach |
| Oldest | 77 | Rada Miejska w Łodzi |