Komitet Wyborczy Wyborców Powiat Sprawny i Przyjazny
| Name: | Komitet Wyborczy Wyborców Powiat Sprawny i Przyjazny | |
| Short name: | KWW Powiat Sprawny i Przyjazny | |
| Type of committee: | Election committees established by electors | |
| Address: | ul.Mogielnicka 28, 05-600 Grójec | |
| Plenipotentiary: | electoral | financial |
| Mirosław Wojciech Maliszewski | Zofia Halina Rachubińska | |
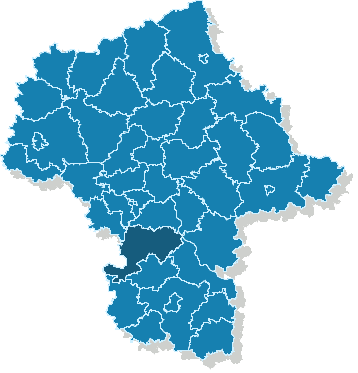
The provinces where the committee has submitted lists of candidates
| Name |
|---|
| pow. grójecki |
The statistics of election committe
Lists submitted
| Description | Number of |
|---|---|
| Number of lists submitted for province council | 0 |
| Number of lists submitted for county councils | 5 |
| Number of lists submitted for councils of cities holding county rights | 0 |
| Number of lists submitted for districts councils of the cap. city of Warsaw | 0 |
| Number of lists registered for communal councils | 0 |
| Totalling | 5 |
Submitted candidates
| Name | Number of candidates | Women | Women (%) | Men | Men (%) |
|---|---|---|---|---|---|
| Number of candidates submitted for the province council | 0 | 0 | - | 0 | - |
| Number of candidates submitted for county councils | 39 | 7 | 17.95% | 32 | 82.05% |
| Number of candidates submitted for councils of cities holding county rights | 0 | 0 | - | 0 | - |
| Number of candidates submitted for districts councils of the cap. city of Warsaw | 0 | 0 | - | 0 | - |
| Number of candidates registered for communal councils | 0 | 0 | - | 0 | - |
| Number of candidates submitted for reeve, mayor and presidential elections | 0 | 0 | - | 0 | - |
| Totalling | 39 | 7 | 17.95% | 32 | 82.05% |
Average age of submitted candidates
| Name | Average age | Average age of women | Average age of men |
|---|---|---|---|
| Average age of candidates submitted for the province council | - | - | - |
| Average age of candidates submitted for county councils | 50 | 45 | 51 |
| Average age of candidates for councils of cities holding county rights | - | - | - |
| Average age of candidates for districts councils of the cap. city of Warsaw | - | - | - |
| Average age of candidates submitted for communal councils | - | - | - |
| Average age of candidates for reeve, mayor, president | - | - | - |
| Totalling | 50 | 45 | 51 |
Submitted candidates grouped by age
| Name | Number of candidates | Women | Women (%) | Men | Men (%) |
|---|---|---|---|---|---|
| 18-29 | 0 | 0 | — | 0 | — |
| 30-39 | 4 | 1 | 25.00% | 3 | 75.00% |
| 40-49 | 9 | 4 | 44.44% | 5 | 55.56% |
| 50-59 | 21 | 2 | 9.52% | 19 | 90.48% |
| 60-69 | 5 | 0 | 0.00% | 5 | 100.00% |
| 70+ | 0 | 0 | — | 0 | — |
The youngest and oldest candidate submitted
| Age | Institution | |
|---|---|---|
| Youngest | 30 | Rada Powiatu Grójeckiego |
| Oldest | 67 | Rada Powiatu Grójeckiego |