Komitet Wyborczy Stowarzyszenie "WYBORCZE FORUM SAMORZĄDOWE"
| Name: | Komitet Wyborczy Stowarzyszenie "WYBORCZE FORUM SAMORZĄDOWE" | |
| Short name: | KW "WYBORCZE FORUM SAMORZĄDOWE" | |
| Type of committee: | Election committees established by organisations | |
| Address: | Pocztowa 12, 89-600 Chojnice | |
| Plenipotentiary: | electoral | financial |
| Aleksander Mikołaj Mrówczyński | Irena Pacek | |
The provinces where the committee has submitted lists of candidates
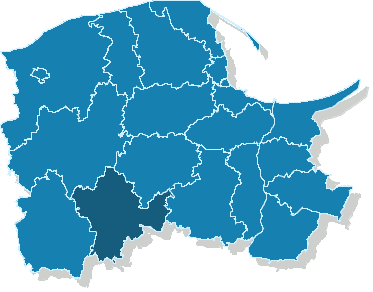
| Name |
|---|
| pow. chojnicki |
The statistics of election committe
Lists submitted
| Description | Number of |
|---|---|
| Number of lists submitted for province council | 0 |
| Number of lists submitted for county councils | 4 |
| Number of lists submitted for councils of cities holding county rights | 0 |
| Number of lists submitted for districts councils of the cap. city of Warsaw | 0 |
| Number of lists registered for communal councils | 14 |
| Totalling | 18 |
Submitted candidates
| Name | Number of candidates | Women | Women (%) | Men | Men (%) |
|---|---|---|---|---|---|
| Number of candidates submitted for the province council | 0 | 0 | - | 0 | - |
| Number of candidates submitted for county councils | 31 | 4 | 12.90% | 27 | 87.10% |
| Number of candidates submitted for councils of cities holding county rights | 0 | 0 | - | 0 | - |
| Number of candidates submitted for districts councils of the cap. city of Warsaw | 0 | 0 | - | 0 | - |
| Number of candidates registered for communal councils | 49 | 3 | 6.12% | 46 | 93.88% |
| Number of candidates submitted for reeve, mayor and presidential elections | 2 | 0 | 0.00% | 2 | 100.00% |
| Totalling | 82 | 7 | 8.54% | 75 | 91.46% |
Average age of submitted candidates
| Name | Average age | Average age of women | Average age of men |
|---|---|---|---|
| Average age of candidates submitted for the province council | - | - | - |
| Average age of candidates submitted for county councils | 46 | 46 | 46 |
| Average age of candidates for councils of cities holding county rights | - | - | - |
| Average age of candidates for districts councils of the cap. city of Warsaw | - | - | - |
| Average age of candidates submitted for communal councils | 39 | 33 | 40 |
| Average age of candidates for reeve, mayor, president | 36 | - | 36 |
| Totalling | 42 | 40 | 42 |
Submitted candidates grouped by age
| Name | Number of candidates | Women | Women (%) | Men | Men (%) |
|---|---|---|---|---|---|
| 18-29 | 9 | 1 | 11.11% | 8 | 88.89% |
| 30-39 | 24 | 2 | 8.33% | 22 | 91.67% |
| 40-49 | 27 | 3 | 11.11% | 24 | 88.89% |
| 50-59 | 18 | 1 | 5.56% | 17 | 94.44% |
| 60-69 | 4 | 0 | 0.00% | 4 | 100.00% |
| 70+ | 0 | 0 | — | 0 | — |
The youngest and oldest candidate submitted
| Age | Institution | |
|---|---|---|
| Youngest | 20 | Rada Miejska w Chojnicach |
| Oldest | 64 | Rada Powiatu Chojnickiego |