Komitet Wyborczy Wyborców Prawicowy Ruch Samorządowy
| Name: | Komitet Wyborczy Wyborców Prawicowy Ruch Samorządowy | |
| Short name: | KWW Prawicowy Ruch Samorządowy | |
| Type of committee: | Election committees established by electors | |
| Address: | Pątnów 71A, 98-335 Pątnów | |
| Plenipotentiary: | electoral | financial |
| Jarosław Klimas | Jacek Papierz | |
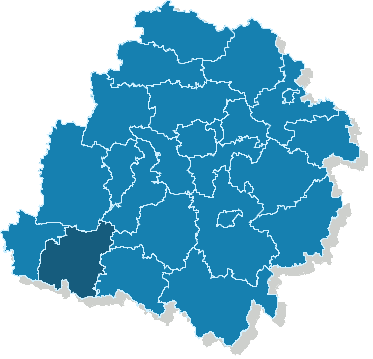
The provinces where the committee has submitted lists of candidates
| Name |
|---|
| pow. wieluński |
The statistics of election committe
Lists submitted
| Description | Number of |
|---|---|
| Number of lists submitted for province council | 0 |
| Number of lists submitted for county councils | 3 |
| Number of lists submitted for councils of cities holding county rights | 0 |
| Number of lists submitted for districts councils of the cap. city of Warsaw | 0 |
| Number of lists registered for communal councils | 22 |
| Totalling | 25 |
Submitted candidates
| Name | Number of candidates | Women | Women (%) | Men | Men (%) |
|---|---|---|---|---|---|
| Number of candidates submitted for the province council | 0 | 0 | - | 0 | - |
| Number of candidates submitted for county councils | 36 | 8 | 22.22% | 28 | 77.78% |
| Number of candidates submitted for councils of cities holding county rights | 0 | 0 | - | 0 | - |
| Number of candidates submitted for districts councils of the cap. city of Warsaw | 0 | 0 | - | 0 | - |
| Number of candidates registered for communal councils | 35 | 10 | 28.57% | 25 | 71.43% |
| Number of candidates submitted for reeve, mayor and presidential elections | 2 | 0 | 0.00% | 2 | 100.00% |
| Totalling | 73 | 18 | 24.66% | 55 | 75.34% |
Average age of submitted candidates
| Name | Average age | Average age of women | Average age of men |
|---|---|---|---|
| Average age of candidates submitted for the province council | - | - | - |
| Average age of candidates submitted for county councils | 40 | 42 | 39 |
| Average age of candidates for councils of cities holding county rights | - | - | - |
| Average age of candidates for districts councils of the cap. city of Warsaw | - | - | - |
| Average age of candidates submitted for communal councils | 41 | 46 | 39 |
| Average age of candidates for reeve, mayor, president | 41 | - | 41 |
| Totalling | 41 | 44 | 39 |
Submitted candidates grouped by age
| Name | Number of candidates | Women | Women (%) | Men | Men (%) |
|---|---|---|---|---|---|
| 18-29 | 13 | 1 | 7.69% | 12 | 92.31% |
| 30-39 | 23 | 5 | 21.74% | 18 | 78.26% |
| 40-49 | 22 | 7 | 31.82% | 15 | 68.18% |
| 50-59 | 10 | 2 | 20.00% | 8 | 80.00% |
| 60-69 | 4 | 2 | 50.00% | 2 | 50.00% |
| 70+ | 1 | 1 | 100.00% | 0 | 0.00% |
The youngest and oldest candidate submitted
| Age | Institution | |
|---|---|---|
| Youngest | 22 | Rada Powiatu w Wieluniu |
| Oldest | 71 | Rada Gminy w Osjakowie |