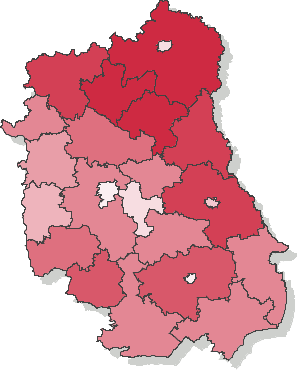
Voting turnout - Ballot on 12.11.2006
Number of dispensed ballot cards untill 12:00
| lubelskie | |||||||||||||||||||||||||||||
|---|---|---|---|---|---|---|---|---|---|---|---|---|---|---|---|---|---|---|---|---|---|---|---|---|---|---|---|---|---|
|
|
||||||||||||||||||||||||||||
|
|||||||||||||||||||||||||||||
* - Dane na podstawie protokołów.
Voting turnout - counties (province Lublin)
Go to top| Name | Number of electors | Number of dispensed ballot cards | Number of precincts | Number of precincts with no data supplied | Voting turnout | |
|---|---|---|---|---|---|---|
| bialski | 90193 | 18266 | 107 | — | 20.25% |
|
| biłgorajski | 82889 | 13775 | 93 | — | 16.62% |
|
| chełmski | 64269 | 12347 | 90 | — | 19.21% |
|
| hrubieszowski | 57512 | 9247 | 65 | — | 16.08% |
|
| janowski | 38662 | 7194 | 37 | — | 18.61% |
|
| krasnostawski | 57036 | 9018 | 86 | — | 15.81% |
|
| kraśnicki | 80831 | 13759 | 84 | — | 17.02% |
|
| lubartowski | 72418 | 12367 | 86 | — | 17.08% |
|
| lubelski | 108767 | 17932 | 120 | — | 16.49% |
|
| łęczyński | 44221 | 7184 | 47 | — | 16.25% |
|
| łukowski | 84861 | 16058 | 88 | — | 18.92% |
|
| opolski | 51273 | 7380 | 59 | — | 14.39% |
|
| parczewski | 30076 | 6202 | 36 | — | 20.62% |
|
| puławski | 93958 | 14166 | 86 | 1 | 15.08% |
|
| radzyński | 49239 | 9845 | 51 | — | 19.99% |
|
| rycki | 48057 | 7704 | 64 | — | 16.03% |
|
| świdnicki | 58887 | 7147 | 53 | — | 12.14% |
|
| tomaszowski | 72625 | 12117 | 92 | — | 16.68% |
|
| włodawski | 33033 | 6420 | 42 | — | 19.44% |
|
| zamojski | 88240 | 16211 | 110 | — | 18.37% |
|
Turnout in cities holding county rights
Go to top| Name | Number of electors | Number of dispensed ballot cards | Number of precincts | Number of precincts with no data supplied | Voting turnout | |
|---|---|---|---|---|---|---|
| m. Biała Podlaska | 45081 | 5719 | 26 | — | 12.69% |
|
| m. Chełm | 55171 | 7309 | 36 | — | 13.25% |
|
| m. Lublin | 278241 | 30163 | 204 | — | 10.84% |
|
| m. Zamość | 53592 | 6204 | 32 | — | 11.58% |
|