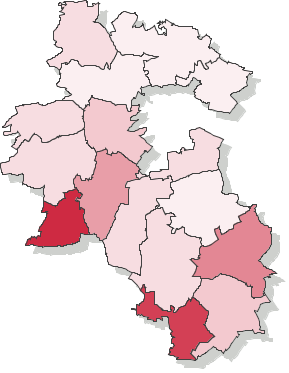
Voting turnout - Ballot on 12.11.2006
| lubelski | |||||||||||||||||||||||||||
|---|---|---|---|---|---|---|---|---|---|---|---|---|---|---|---|---|---|---|---|---|---|---|---|---|---|---|---|
|
|
||||||||||||||||||||||||||
|
|||||||||||||||||||||||||||
* - Dane na podstawie protokołów.
Voting turnout - Number of ballot cards dispensed to voters (county lubelski, province lubelskie)
Go to top| Name | Number of electors | Number of dispensed ballot cards | Number of precincts | Number of precincts with no data supplied | Voting turnout | |
|---|---|---|---|---|---|---|
| gm. Bełżyce | 10671 | 5058 | 13 | — | 47.40% |
|
| gm. Borzechów | 2949 | 2037 | 13 | — | 69.07% |
|
| gm. Bychawa | 9700 | 4563 | 14 | — | 47.04% |
|
| gm. Garbów | 6949 | 3243 | 8 | — | 46.67% |
|
| gm. Głusk | 5312 | 2467 | 11 | — | 46.44% |
|
| gm. Jabłonna | 5988 | 2575 | 6 | — | 43.00% |
|
| gm. Jastków | 9135 | 4015 | 12 | — | 43.95% |
|
| gm. Konopnica | 8716 | 4393 | 13 | — | 50.40% |
|
| gm. Krzczonów | 4204 | 2458 | 13 | — | 58.47% |
|
| gm. Niedrzwica Duża | 8346 | 4582 | 9 | — | 54.90% |
|
| gm. Niemce | 12288 | 5569 | 13 | — | 45.32% |
|
| gm. Strzyżewice | 5844 | 2759 | 9 | — | 47.21% |
|
| gm. Wojciechów | 4702 | 2176 | 5 | — | 46.28% |
|
| gm. Wólka | 6583 | 2959 | 14 | — | 44.95% |
|
| gm. Wysokie | 4178 | 2027 | 6 | — | 48.52% |
|
| gm. Zakrzew | 2753 | 1776 | 14 | — | 64.51% |
|