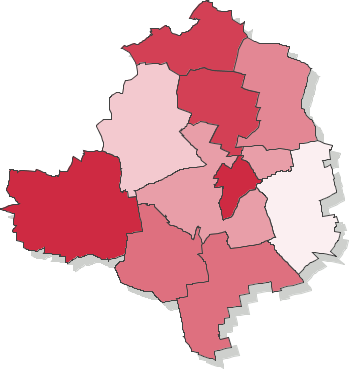
Voting turnout - Ballot on 12.11.2006
| łowicki | |||||||||||||||||||||||||||
|---|---|---|---|---|---|---|---|---|---|---|---|---|---|---|---|---|---|---|---|---|---|---|---|---|---|---|---|
|
|
||||||||||||||||||||||||||
|
|||||||||||||||||||||||||||
* - Dane na podstawie protokołów.
Voting turnout - Number of ballot cards dispensed to voters (county łowicki, province łódzkie)
Go to top| Name | Number of electors | Number of dispensed ballot cards | Number of precincts | Number of precincts with no data supplied | Voting turnout | |
|---|---|---|---|---|---|---|
| gm. Bielawy | 4857 | 2534 | 13 | — | 52.17% |
|
| gm. Chąśno | 1973 | 982 | 10 | — | 49.77% |
|
| gm. Domaniewice | 3752 | 1791 | 10 | — | 47.73% |
|
| gm. Kiernozia | 2521 | 1263 | 8 | — | 50.10% |
|
| gm. Kocierzew Południowy | 3462 | 1573 | 14 | — | 45.44% |
|
| gm. Łowicz | 5350 | 2362 | 13 | — | 44.15% |
|
| gm. Łyszkowice | 5412 | 2526 | 10 | — | 46.67% |
|
| gm. Nieborów | 7552 | 2875 | 7 | — | 38.07% |
|
| gm. Zduny | 4068 | 1675 | 10 | — | 41.18% |
|
| m. Łowicz | 24718 | 12658 | 18 | — | 51.21% |
|