Voting turnout - Ballot on 12.11.2006
Number of dispensed ballot cards untill 16:30
| pomorskie | |||||||||||||||||||||||||||||
|---|---|---|---|---|---|---|---|---|---|---|---|---|---|---|---|---|---|---|---|---|---|---|---|---|---|---|---|---|---|
|
|
||||||||||||||||||||||||||||
|
|||||||||||||||||||||||||||||
* - Dane na podstawie protokołów.
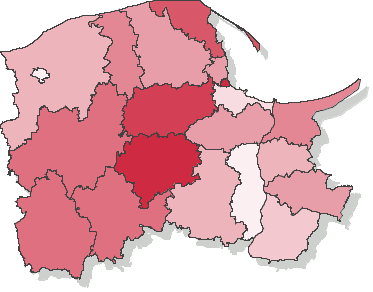
Voting turnout - counties (province Pomerania)
Go to top| Name | Number of electors | Number of dispensed ballot cards | Number of precincts | Number of precincts with no data supplied | Voting turnout | |
|---|---|---|---|---|---|---|
| bytowski | 58509 | 21892 | 62 | — | 37.42% |
|
| chojnicki | 70807 | 27125 | 58 | — | 38.31% |
|
| człuchowski | 44808 | 17089 | 47 | — | 38.14% |
|
| gdański | 65213 | 22250 | 47 | — | 34.12% |
|
| kartuski | 78477 | 31933 | 63 | — | 40.69% |
|
| kościerski | 51015 | 22024 | 45 | — | 43.17% |
|
| kwidzyński | 62452 | 19522 | 51 | — | 31.26% |
|
| lęborski | 49596 | 18084 | 43 | — | 36.46% |
|
| malborski | 50345 | 16759 | 37 | — | 33.29% |
|
| nowodworski | 28357 | 10230 | 26 | — | 36.08% |
|
| pucki | 56908 | 22246 | 46 | — | 39.09% |
|
| słupski | 72206 | 24044 | 71 | — | 33.30% |
|
| starogardzki | 93034 | 30727 | 87 | — | 33.03% |
|
| sztumski | 32951 | 11162 | 33 | — | 33.87% |
|
| tczewski | 87267 | 25178 | 73 | — | 28.85% |
|
| wejherowski | 136805 | 47329 | 88 | — | 34.60% |
|
Turnout in cities holding county rights
Go to top| Name | Number of electors | Number of dispensed ballot cards | Number of precincts | Number of precincts with no data supplied | Voting turnout | |
|---|---|---|---|---|---|---|
| m. Gdańsk | 361448 | 108737 | 212 | — | 30.08% |
|
| m. Gdynia | 201212 | 69837 | 118 | — | 34.71% |
|
| m. Słupsk | 78539 | 21600 | 46 | — | 27.50% |
|
| m. Sopot | 33219 | 13913 | 21 | — | 41.88% |
|