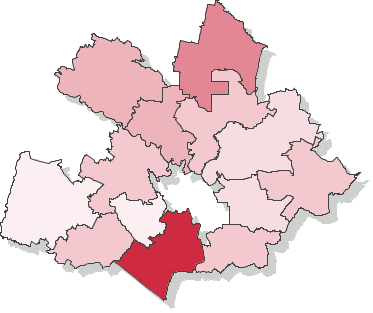
Voting turnout - Ballot on 12.11.2006
Number of dispensed ballot cards untill 12:00
| opolski | |||||||||||||||||||||||||||
|---|---|---|---|---|---|---|---|---|---|---|---|---|---|---|---|---|---|---|---|---|---|---|---|---|---|---|---|
|
|
||||||||||||||||||||||||||
|
|||||||||||||||||||||||||||
* - Dane na podstawie protokołów.
Voting turnout - Number of ballot cards dispensed to voters (county opolski, province opolskie)
Go to top| Name | Number of electors | Number of dispensed ballot cards | Number of precincts | Number of precincts with no data supplied | Voting turnout | |
|---|---|---|---|---|---|---|
| gm. Chrząstowice | 5275 | 624 | 5 | — | 11.83% |
|
| gm. Dąbrowa | 7413 | 1007 | 8 | — | 13.58% |
|
| gm. Dobrzeń Wielki | 11132 | 1575 | 12 | — | 14.15% |
|
| gm. Komprachcice | 8731 | 1007 | 6 | — | 11.53% |
|
| gm. Łubniany | 7498 | 955 | 4 | — | 12.74% |
|
| gm. Murów | 4741 | 761 | 5 | — | 16.05% |
|
| gm. Niemodlin | 10808 | 1135 | 11 | — | 10.50% |
|
| gm. Ozimek | 17141 | 2204 | 16 | — | 12.86% |
|
| gm. Popielów | 6828 | 966 | 5 | — | 14.15% |
|
| gm. Prószków | 7829 | 1673 | 9 | — | 21.37% |
|
| gm. Tarnów Opolski | 7825 | 1014 | 8 | — | 12.96% |
|
| gm. Tułowice | 4319 | 553 | 4 | — | 12.80% |
|
| gm. Turawa | 7787 | 965 | 8 | — | 12.39% |
|