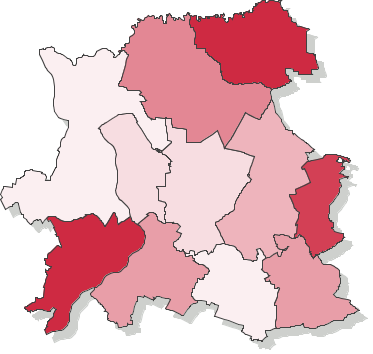
Voting turnout - Ballot on 12.11.2006
| puławski | |||||||||||||||||||||||||||
|---|---|---|---|---|---|---|---|---|---|---|---|---|---|---|---|---|---|---|---|---|---|---|---|---|---|---|---|
|
|
||||||||||||||||||||||||||
|
|||||||||||||||||||||||||||
* - Dane na podstawie protokołów.
Voting turnout - Number of ballot cards dispensed to voters (county puławski, province lubelskie)
Go to top| Name | Number of electors | Number of dispensed ballot cards | Number of precincts | Number of precincts with no data supplied | Voting turnout | |
|---|---|---|---|---|---|---|
| gm. Baranów | 3430 | 2342 | 11 | — | 68.28% |
|
| gm. Janowiec | 2953 | 1937 | 6 | — | 65.59% |
|
| gm. Kazimierz Dolny | 5624 | 2793 | 8 | — | 49.66% |
|
| gm. Końskowola | 6746 | 2835 | 13 | — | 42.02% |
|
| gm. Kurów | 6363 | 2957 | 9 | — | 46.47% |
|
| gm. Markuszów | 2435 | 1566 | 10 | — | 64.31% |
|
| gm. Nałęczów | 7553 | 3858 | 15 | — | 51.08% |
|
| gm. Puławy | 8900 | 3261 | 11 | — | 36.64% |
|
| gm. Wąwolnica | 2510 | 970 | 5 | — | 38.65% |
|
| gm. Żyrzyn | 5295 | 2874 | 12 | — | 54.28% |
|
| m. Puławy | 41630 | 17411 | 24 | — | 41.82% |
|