Voting turnout - Ballot on 12.11.2006
Number of dispensed ballot cards untill 12:00
| lubartowski | |||||||||||||||||||||||||||
|---|---|---|---|---|---|---|---|---|---|---|---|---|---|---|---|---|---|---|---|---|---|---|---|---|---|---|---|
|
|
||||||||||||||||||||||||||
|
|||||||||||||||||||||||||||
* - Dane na podstawie protokołów.
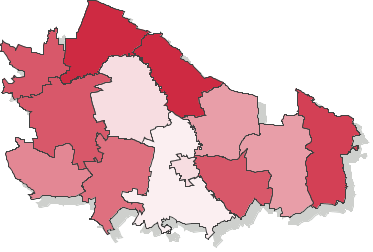
Voting turnout - Number of ballot cards dispensed to voters (county lubartowski, province lubelskie)
Go to top| Name | Number of electors | Number of dispensed ballot cards | Number of precincts | Number of precincts with no data supplied | Voting turnout | |
|---|---|---|---|---|---|---|
| gm. Abramów | 3488 | 645 | 7 | — | 18.49% |
|
| gm. Firlej | 4801 | 689 | 8 | — | 14.35% |
|
| gm. Jeziorzany | 2514 | 511 | 3 | — | 20.33% |
|
| gm. Kamionka | 5034 | 972 | 9 | — | 19.31% |
|
| gm. Kock | 5472 | 1244 | 8 | — | 22.73% |
|
| gm. Lubartów | 7812 | 960 | 11 | — | 12.29% |
|
| gm. Michów | 5247 | 1077 | 6 | — | 20.53% |
|
| gm. Niedźwiada | 5022 | 853 | 6 | — | 16.99% |
|
| gm. Ostrówek | 3365 | 750 | 5 | — | 22.29% |
|
| gm. Ostrów Lubelski | 4412 | 729 | 4 | — | 16.52% |
|
| gm. Serniki | 3774 | 777 | 4 | — | 20.59% |
|
| gm. Uścimów | 2761 | 588 | 3 | — | 21.30% |
|
| m. Lubartów | 18716 | 2572 | 12 | — | 13.74% |
|