Voting turnout - Ballot on 12.11.2006
Number of dispensed ballot cards untill 12:00
| iławski | |||||||||||||||||||||||||||
|---|---|---|---|---|---|---|---|---|---|---|---|---|---|---|---|---|---|---|---|---|---|---|---|---|---|---|---|
|
|
||||||||||||||||||||||||||
|
|||||||||||||||||||||||||||
* - Dane na podstawie protokołów.
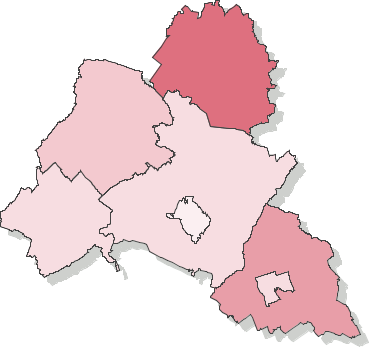
Voting turnout - Number of ballot cards dispensed to voters (county iławski, province warmińsko-mazurskie)
Go to top| Name | Number of electors | Number of dispensed ballot cards | Number of precincts | Number of precincts with no data supplied | Voting turnout | |
|---|---|---|---|---|---|---|
| gm. Iława | 8727 | 1270 | 12 | — | 14.55% |
|
| gm. Kisielice | 4826 | 701 | 6 | — | 14.53% |
|
| gm. Lubawa | 7703 | 1492 | 8 | — | 19.37% |
|
| gm. Susz | 9839 | 1605 | 11 | — | 16.31% |
|
| gm. Zalewo | 5723 | 1362 | 4 | — | 23.80% |
|
| m. Iława | 26536 | 3107 | 16 | — | 11.71% |
|
| m. Lubawa | 7259 | 1096 | 4 | — | 15.10% |
|