Voting turnout - Ballot on 12.11.2006
| lubartowski | |||||||||||||||||||||||||||
|---|---|---|---|---|---|---|---|---|---|---|---|---|---|---|---|---|---|---|---|---|---|---|---|---|---|---|---|
|
|
||||||||||||||||||||||||||
|
|||||||||||||||||||||||||||
* - Dane na podstawie protokołów.
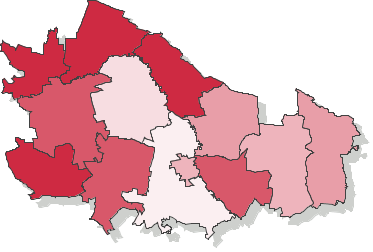
Voting turnout - Number of ballot cards dispensed to voters (county lubartowski, province lubelskie)
Go to top| Name | Number of electors | Number of dispensed ballot cards | Number of precincts | Number of precincts with no data supplied | Voting turnout | |
|---|---|---|---|---|---|---|
| gm. Abramów | 3488 | 2197 | 10 | — | 62.99% |
|
| gm. Firlej | 4403 | 2094 | 9 | — | 47.56% |
|
| gm. Jeziorzany | 2514 | 1567 | 7 | — | 62.33% |
|
| gm. Kamionka | 5034 | 2914 | 10 | — | 57.89% |
|
| gm. Kock | 5472 | 3471 | 9 | — | 63.43% |
|
| gm. Lubartów | 7813 | 3411 | 16 | — | 43.66% |
|
| gm. Michów | 4916 | 2872 | 11 | — | 58.42% |
|
| gm. Niedźwiada | 4225 | 2193 | 11 | — | 51.91% |
|
| gm. Ostrówek | 3365 | 2099 | 12 | — | 62.38% |
|
| gm. Ostrów Lubelski | 4412 | 2265 | 14 | — | 51.34% |
|
| gm. Serniki | 3773 | 2201 | 10 | — | 58.34% |
|
| gm. Uścimów | 2761 | 1464 | 11 | — | 53.02% |
|
| m. Lubartów | 18720 | 9337 | 12 | — | 49.88% |
|