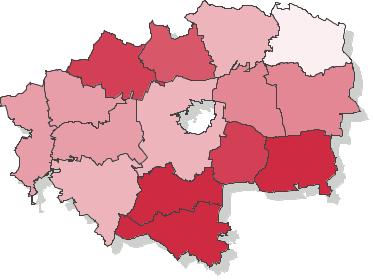
Voting turnout - Ballot on 12.11.2006
| zamojski | |||||||||||||||||||||||||||
|---|---|---|---|---|---|---|---|---|---|---|---|---|---|---|---|---|---|---|---|---|---|---|---|---|---|---|---|
|
|
||||||||||||||||||||||||||
|
|||||||||||||||||||||||||||
* - Dane na podstawie protokołów.
Voting turnout - Number of ballot cards dispensed to voters (county zamojski, province lubelskie)
Go to top| Name | Number of electors | Number of dispensed ballot cards | Number of precincts | Number of precincts with no data supplied | Voting turnout | |
|---|---|---|---|---|---|---|
| gm. Adamów | 4020 | 2476 | 12 | — | 61.59% |
|
| gm. Grabowiec | 3657 | 1427 | 11 | — | 39.02% |
|
| gm. Komarów-Osada | 4492 | 2834 | 9 | — | 63.09% |
|
| gm. Krasnobród | 5682 | 3474 | 11 | — | 61.14% |
|
| gm. Łabunie | 4862 | 2850 | 9 | — | 58.62% |
|
| gm. Miączyn | 5002 | 2561 | 10 | — | 51.20% |
|
| gm. Nielisz | 4922 | 2916 | 14 | — | 59.24% |
|
| gm. Radecznica | 5195 | 2634 | 14 | — | 50.70% |
|
| gm. Sitno | 5469 | 2802 | 9 | — | 51.23% |
|
| gm. Skierbieszów | 3978 | 1889 | 8 | — | 47.49% |
|
| gm. Stary Zamość | 4373 | 2548 | 11 | — | 58.27% |
|
| gm. Sułów | 4217 | 2083 | 11 | — | 49.40% |
|
| gm. Szczebrzeszyn | 9681 | 4769 | 10 | — | 49.26% |
|
| gm. Zamość | 15993 | 7559 | 19 | — | 47.26% |
|
| gm. Zwierzyniec | 5857 | 2744 | 11 | — | 46.85% |
|