Voting turnout - Ballot on 12.11.2006
Number of dispensed ballot cards untill 16:30
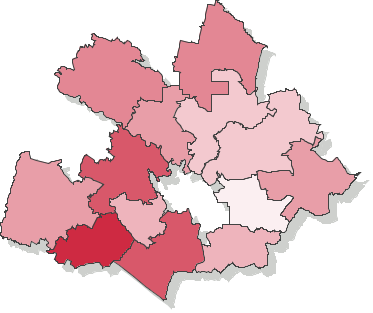
| opolski | |||||||||||||||||||||||||||
|---|---|---|---|---|---|---|---|---|---|---|---|---|---|---|---|---|---|---|---|---|---|---|---|---|---|---|---|
|
|
||||||||||||||||||||||||||
|
|||||||||||||||||||||||||||
* - Dane na podstawie protokołów.
Voting turnout - Number of ballot cards dispensed to voters (county opolski, province opolskie)
Go to top| Name | Number of electors | Number of dispensed ballot cards | Number of precincts | Number of precincts with no data supplied | Voting turnout | |
|---|---|---|---|---|---|---|
| gm. Chrząstowice | 5275 | 1078 | 5 | — | 20.44% |
|
| gm. Dąbrowa | 7413 | 2500 | 8 | — | 33.72% |
|
| gm. Dobrzeń Wielki | 11128 | 3048 | 12 | — | 27.39% |
|
| gm. Komprachcice | 8731 | 2298 | 6 | — | 26.32% |
|
| gm. Łubniany | 7500 | 1885 | 4 | — | 25.13% |
|
| gm. Murów | 4741 | 1437 | 5 | — | 30.31% |
|
| gm. Niemodlin | 10808 | 3036 | 11 | — | 28.09% |
|
| gm. Ozimek | 17141 | 4924 | 16 | — | 28.73% |
|
| gm. Popielów | 6827 | 2055 | 5 | — | 30.10% |
|
| gm. Prószków | 7829 | 2634 | 9 | — | 33.64% |
|
| gm. Tarnów Opolski | 7825 | 2104 | 8 | — | 26.89% |
|
| gm. Tułowice | 4322 | 1605 | 4 | — | 37.14% |
|
| gm. Turawa | 7787 | 1897 | 8 | — | 24.36% |
|