Voting turnout - Ballot on 12.11.2006
| lubelskie | |||||||||||||||||||||||||||||
|---|---|---|---|---|---|---|---|---|---|---|---|---|---|---|---|---|---|---|---|---|---|---|---|---|---|---|---|---|---|
|
|
||||||||||||||||||||||||||||
|
|||||||||||||||||||||||||||||
* - Dane na podstawie protokołów.
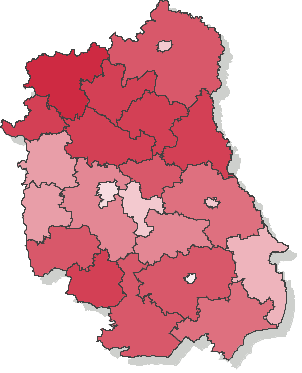
Voting turnout - counties (province Lublin)
Go to top| Name | Number of electors | Number of dispensed ballot cards | Number of precincts | Number of precincts with no data supplied | Voting turnout | |
|---|---|---|---|---|---|---|
| bialski | 88659 | 46923 | 201 | — | 52.93% |
|
| biłgorajski | 82253 | 43705 | 132 | — | 53.13% |
|
| chełmski | 62926 | 31827 | 156 | — | 50.58% |
|
| hrubieszowski | 57511 | 26269 | 89 | — | 45.68% |
|
| janowski | 35853 | 19613 | 58 | — | 54.70% |
|
| krasnostawski | 54294 | 26336 | 107 | — | 48.51% |
|
| kraśnicki | 80412 | 41748 | 130 | — | 51.92% |
|
| lubartowski | 70896 | 38085 | 142 | — | 53.72% |
|
| lubelski | 108318 | 52657 | 173 | — | 48.61% |
|
| łęczyński | 44060 | 22785 | 70 | — | 51.71% |
|
| łukowski | 83744 | 48232 | 125 | — | 57.59% |
|
| opolski | 51273 | 23930 | 96 | — | 46.67% |
|
| parczewski | 29931 | 16105 | 69 | — | 53.81% |
|
| puławski | 93439 | 42804 | 124 | — | 45.81% |
|
| radzyński | 48605 | 26910 | 78 | — | 55.36% |
|
| rycki | 48060 | 26104 | 81 | — | 54.32% |
|
| świdnicki | 58893 | 25324 | 63 | — | 43.00% |
|
| tomaszowski | 71183 | 35442 | 135 | — | 49.79% |
|
| włodawski | 32948 | 17849 | 77 | — | 54.17% |
|
| zamojski | 87400 | 45566 | 169 | — | 52.14% |
|
Turnout in cities holding county rights
Go to top| Name | Number of electors | Number of dispensed ballot cards | Number of precincts | Number of precincts with no data supplied | Voting turnout | |
|---|---|---|---|---|---|---|
| m. Biała Podlaska | 45152 | 19324 | 26 | — | 42.80% |
|
| m. Chełm | 55175 | 23096 | 36 | — | 41.86% |
|
| m. Lublin | 276384 | 114776 | 204 | — | 41.53% |
|
| m. Zamość | 53575 | 20276 | 32 | — | 37.85% |
|