Voting turnout - Ballot on 12.11.2006
Number of dispensed ballot cards untill 16:30
| lubartowski | |||||||||||||||||||||||||||
|---|---|---|---|---|---|---|---|---|---|---|---|---|---|---|---|---|---|---|---|---|---|---|---|---|---|---|---|
|
|
||||||||||||||||||||||||||
|
|||||||||||||||||||||||||||
* - Dane na podstawie protokołów.
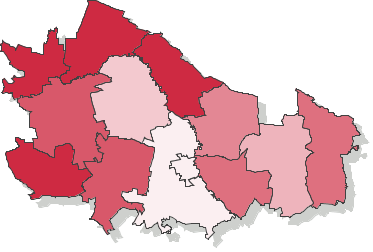
Voting turnout - Number of ballot cards dispensed to voters (county lubartowski, province lubelskie)
Go to top| Name | Number of electors | Number of dispensed ballot cards | Number of precincts | Number of precincts with no data supplied | Voting turnout | |
|---|---|---|---|---|---|---|
| gm. Abramów | 3488 | 1755 | 7 | — | 50.32% |
|
| gm. Firlej | 4801 | 1795 | 8 | — | 37.39% |
|
| gm. Jeziorzany | 2514 | 1313 | 3 | — | 52.23% |
|
| gm. Kamionka | 5034 | 2401 | 9 | — | 47.70% |
|
| gm. Kock | 5472 | 2764 | 8 | — | 50.51% |
|
| gm. Lubartów | 7813 | 2539 | 11 | — | 32.50% |
|
| gm. Michów | 5244 | 2475 | 6 | — | 47.20% |
|
| gm. Niedźwiada | 5022 | 2164 | 6 | — | 43.09% |
|
| gm. Ostrówek | 3365 | 1738 | 5 | — | 51.65% |
|
| gm. Ostrów Lubelski | 4412 | 1749 | 4 | — | 39.64% |
|
| gm. Serniki | 3773 | 1731 | 4 | — | 45.88% |
|
| gm. Uścimów | 2761 | 1261 | 3 | — | 45.67% |
|
| m. Lubartów | 18720 | 6265 | 12 | — | 33.47% |
|