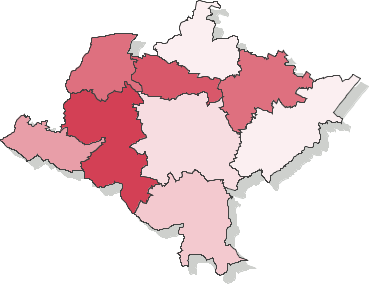
Voting turnout - Ballot on 12.11.2006
| nyski | |||||||||||||||||||||||||||
|---|---|---|---|---|---|---|---|---|---|---|---|---|---|---|---|---|---|---|---|---|---|---|---|---|---|---|---|
|
|
||||||||||||||||||||||||||
|
|||||||||||||||||||||||||||
* - Dane na podstawie protokołów.
Voting turnout - Number of ballot cards dispensed to voters (county nyski, province opolskie)
Go to top| Name | Number of electors | Number of dispensed ballot cards | Number of precincts | Number of precincts with no data supplied | Voting turnout | |
|---|---|---|---|---|---|---|
| gm. Głuchołazy | 20966 | 8460 | 25 | — | 40.35% |
|
| gm. Kamiennik | 2848 | 1364 | 7 | — | 47.89% |
|
| gm. Korfantów | 7684 | 2717 | 12 | — | 35.36% |
|
| gm. Łambinowice | 6197 | 2984 | 10 | — | 48.15% |
|
| gm. Nysa | 48669 | 18770 | 34 | — | 38.57% |
|
| gm. Otmuchów | 10985 | 5943 | 11 | — | 54.10% |
|
| gm. Paczków | 11038 | 4939 | 13 | — | 44.75% |
|
| gm. Pakosławice | 3025 | 1519 | 6 | — | 50.21% |
|
| gm. Skoroszyce | 4597 | 1612 | 6 | — | 35.07% |
|