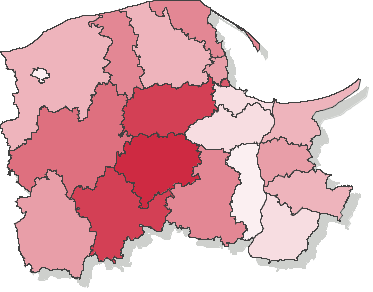
Voting turnout - Ballot on 12.11.2006
Number of dispensed ballot cards untill 12:00
| pomorskie | |||||||||||||||||||||||||||||
|---|---|---|---|---|---|---|---|---|---|---|---|---|---|---|---|---|---|---|---|---|---|---|---|---|---|---|---|---|---|
|
|
||||||||||||||||||||||||||||
|
|||||||||||||||||||||||||||||
* - Dane na podstawie protokołów.
Voting turnout - counties (province Pomerania)
Go to top| Name | Number of electors | Number of dispensed ballot cards | Number of precincts | Number of precincts with no data supplied | Voting turnout | |
|---|---|---|---|---|---|---|
| bytowski | 58519 | 9574 | 62 | — | 16.36% |
|
| chojnicki | 70794 | 12987 | 58 | — | 18.34% |
|
| człuchowski | 44803 | 6607 | 47 | — | 14.75% |
|
| gdański | 65206 | 7737 | 47 | — | 11.87% |
|
| kartuski | 78619 | 14267 | 63 | — | 18.15% |
|
| kościerski | 51013 | 10028 | 45 | — | 19.66% |
|
| kwidzyński | 62355 | 7323 | 51 | — | 11.74% |
|
| lęborski | 49596 | 7454 | 43 | — | 15.03% |
|
| malborski | 50341 | 7342 | 37 | — | 14.58% |
|
| nowodworski | 28356 | 3784 | 26 | — | 13.34% |
|
| pucki | 56864 | 8561 | 46 | — | 15.06% |
|
| słupski | 72223 | 9965 | 71 | — | 13.80% |
|
| starogardzki | 93031 | 14235 | 87 | — | 15.30% |
|
| sztumski | 32958 | 4495 | 33 | — | 13.64% |
|
| tczewski | 87102 | 9456 | 73 | — | 10.86% |
|
| wejherowski | 136782 | 18489 | 88 | — | 13.52% |
|
Turnout in cities holding county rights
Go to top| Name | Number of electors | Number of dispensed ballot cards | Number of precincts | Number of precincts with no data supplied | Voting turnout | |
|---|---|---|---|---|---|---|
| m. Gdańsk | 361614 | 42410 | 212 | — | 11.73% |
|
| m. Gdynia | 201133 | 28892 | 118 | — | 14.36% |
|
| m. Słupsk | 78509 | 7859 | 46 | — | 10.01% |
|
| m. Sopot | 33220 | 5719 | 21 | — | 17.22% |
|