Voting turnout - Ballot on 12.11.2006
Number of dispensed ballot cards untill 16:30
| iławski | |||||||||||||||||||||||||||
|---|---|---|---|---|---|---|---|---|---|---|---|---|---|---|---|---|---|---|---|---|---|---|---|---|---|---|---|
|
|
||||||||||||||||||||||||||
|
|||||||||||||||||||||||||||
* - Dane na podstawie protokołów.
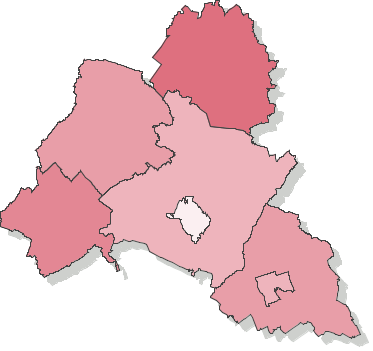
Voting turnout - Number of ballot cards dispensed to voters (county iławski, province warmińsko-mazurskie)
Go to top| Name | Number of electors | Number of dispensed ballot cards | Number of precincts | Number of precincts with no data supplied | Voting turnout | |
|---|---|---|---|---|---|---|
| gm. Iława | 8727 | 3314 | 12 | — | 37.97% |
|
| gm. Kisielice | 4826 | 2053 | 6 | — | 42.54% |
|
| gm. Lubawa | 7704 | 3082 | 8 | — | 40.01% |
|
| gm. Susz | 9839 | 4055 | 11 | — | 41.21% |
|
| gm. Zalewo | 5723 | 2681 | 4 | — | 46.85% |
|
| m. Iława | 26520 | 7807 | 16 | — | 29.44% |
|
| m. Lubawa | 7259 | 2717 | 4 | — | 37.43% |
|