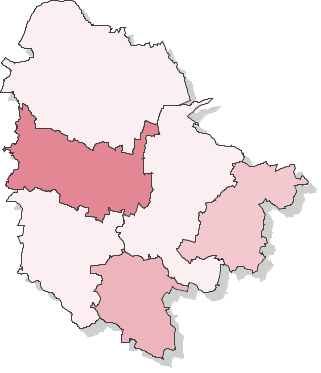
Voting turnout - Ballot on 12.11.2006
| trzebnicki | |||||||||||||||||||||||||||
|---|---|---|---|---|---|---|---|---|---|---|---|---|---|---|---|---|---|---|---|---|---|---|---|---|---|---|---|

|
|
||||||||||||||||||||||||||
|
|||||||||||||||||||||||||||
* - Dane na podstawie protokołów.
Voting turnout - Number of ballot cards dispensed to voters (county trzebnicki, province dolnośląskie)
Go to top| Name | Number of electors | Number of dispensed ballot cards | Number of precincts | Number of precincts with no data supplied | Voting turnout | |
|---|---|---|---|---|---|---|
| gm. Oborniki Śląskie | 14108 | 6126 | 14 | — | 43.42% |
|
| gm. Prusice | 6226 | 3597 | 9 | — | 57.77% |
|
| gm. Trzebnica | 17325 | 7785 | 11 | — | 44.94% |
|
| gm. Wisznia Mała | 6409 | 3303 | 12 | — | 51.54% |
|
| gm. Zawonia | 4216 | 2121 | 13 | — | 50.31% |
|
| gm. Żmigród | 11773 | 5207 | 13 | — | 44.23% |
|