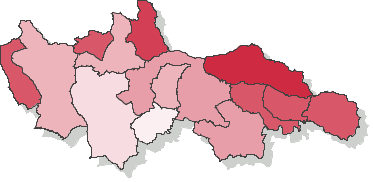
Voting turnout - Ballot on 12.11.2006
| nowotarski | |||||||||||||||||||||||||||
|---|---|---|---|---|---|---|---|---|---|---|---|---|---|---|---|---|---|---|---|---|---|---|---|---|---|---|---|
|
|
||||||||||||||||||||||||||
|
|||||||||||||||||||||||||||
* - Dane na podstawie protokołów.
Voting turnout - Number of ballot cards dispensed to voters (county nowotarski, province małopolskie)
Go to top| Name | Number of electors | Number of dispensed ballot cards | Number of precincts | Number of precincts with no data supplied | Voting turnout | |
|---|---|---|---|---|---|---|
| gm. Czarny Dunajec | 15964 | 6132 | 21 | — | 38.41% |
|
| gm. Czorsztyn | 5292 | 2600 | 6 | — | 49.13% |
|
| gm. Jabłonka | 12469 | 5198 | 11 | — | 41.69% |
|
| gm. Krościenko nad Dunajcem | 4860 | 2418 | 6 | — | 49.75% |
|
| gm. Lipnica Wielka | 4004 | 2034 | 5 | — | 50.80% |
|
| gm. Łapsze Niżne | 6597 | 2849 | 9 | — | 43.19% |
|
| gm. Nowy Targ | 16407 | 7105 | 21 | — | 43.30% |
|
| gm. Ochotnica Dolna | 5832 | 3199 | 4 | — | 54.85% |
|
| gm. Raba Wyżna | 10209 | 4320 | 10 | — | 42.32% |
|
| gm. Rabka-Zdrój | 13602 | 7113 | 11 | — | 52.29% |
|
| gm. Spytkowice | 2968 | 1463 | 3 | — | 49.29% |
|
| gm. Szaflary | 7426 | 2583 | 9 | — | 34.78% |
|
| m. Nowy Targ | 26145 | 10963 | 17 | — | 41.93% |
|
| m. Szczawnica | 5789 | 2853 | 6 | — | 49.28% |
|