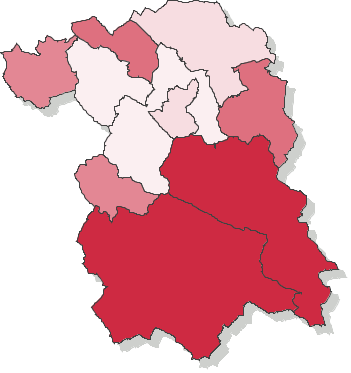
Voting turnout - Ballot on 12.11.2006
| gorlicki | |||||||||||||||||||||||||||
|---|---|---|---|---|---|---|---|---|---|---|---|---|---|---|---|---|---|---|---|---|---|---|---|---|---|---|---|
|
|
||||||||||||||||||||||||||
|
|||||||||||||||||||||||||||
* - Dane na podstawie protokołów.
Voting turnout - Number of ballot cards dispensed to voters (county gorlicki, province małopolskie)
Go to top| Name | Number of electors | Number of dispensed ballot cards | Number of precincts | Number of precincts with no data supplied | Voting turnout | |
|---|---|---|---|---|---|---|
| gm. Biecz | 13370 | 5796 | 13 | — | 43.35% |
|
| gm. Bobowa | 6726 | 3440 | 8 | — | 51.14% |
|
| gm. Gorlice | 10648 | 4454 | 9 | — | 41.83% |
|
| gm. Lipinki | 5335 | 2785 | 7 | — | 52.20% |
|
| gm. Łużna | 6274 | 2517 | 7 | — | 40.12% |
|
| gm. Moszczenica | 3709 | 1964 | 3 | — | 52.95% |
|
| gm. Ropa | 3489 | 1811 | 4 | — | 51.91% |
|
| gm. Sękowa | 3735 | 2220 | 7 | — | 59.44% |
|
| gm. Uście Gorlickie | 4279 | 2578 | 9 | — | 60.25% |
|
| m. Gorlice | 24168 | 10411 | 22 | — | 43.08% |
|