Voting turnout - Ballot on 12.11.2006
| lubiński | |||||||||||||||||||||||||||
|---|---|---|---|---|---|---|---|---|---|---|---|---|---|---|---|---|---|---|---|---|---|---|---|---|---|---|---|
|
|
||||||||||||||||||||||||||
|
|||||||||||||||||||||||||||
* - Dane na podstawie protokołów.
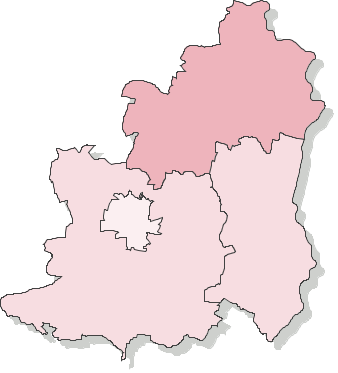
Voting turnout - Number of ballot cards dispensed to voters (county lubiński, province dolnośląskie)
Go to top| Name | Number of electors | Number of dispensed ballot cards | Number of precincts | Number of precincts with no data supplied | Voting turnout | |
|---|---|---|---|---|---|---|
| gm. Lubin | 8728 | 4686 | 14 | — | 53.69% |
|
| gm. Rudna | 5641 | 3986 | 11 | — | 70.66% |
|
| gm. Ścinawa | 8493 | 4475 | 8 | — | 52.69% |
|
| m. Lubin | 63423 | 29063 | 51 | — | 45.82% |
|