Voting turnout - Ballot on 12.11.2006
Number of dispensed ballot cards untill 16:30
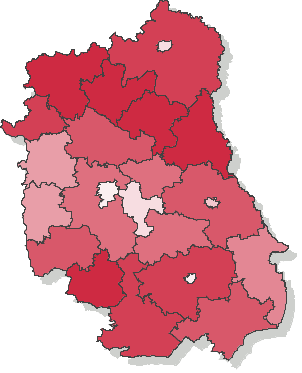
| lubelskie | |||||||||||||||||||||||||||||
|---|---|---|---|---|---|---|---|---|---|---|---|---|---|---|---|---|---|---|---|---|---|---|---|---|---|---|---|---|---|
|
|
||||||||||||||||||||||||||||
|
|||||||||||||||||||||||||||||
* - Dane na podstawie protokołów.
Voting turnout - counties (province Lublin)
Go to top| Name | Number of electors | Number of dispensed ballot cards | Number of precincts | Number of precincts with no data supplied | Voting turnout | |
|---|---|---|---|---|---|---|
| bialski | 90073 | 38170 | 107 | — | 42.38% |
|
| biłgorajski | 82893 | 34845 | 93 | — | 42.04% |
|
| chełmski | 64270 | 26850 | 90 | — | 41.78% |
|
| hrubieszowski | 57518 | 21641 | 65 | — | 37.62% |
|
| janowski | 38673 | 16936 | 37 | — | 43.79% |
|
| krasnostawski | 57020 | 22022 | 86 | — | 38.62% |
|
| kraśnicki | 80869 | 33608 | 84 | — | 41.56% |
|
| lubartowski | 72419 | 29950 | 86 | — | 41.36% |
|
| lubelski | 108802 | 41906 | 120 | — | 38.52% |
|
| łęczyński | 44220 | 17339 | 47 | — | 39.21% |
|
| łukowski | 84854 | 38488 | 88 | — | 45.36% |
|
| opolski | 51275 | 18681 | 59 | — | 36.43% |
|
| parczewski | 30076 | 13133 | 36 | — | 43.67% |
|
| puławski | 95468 | 33495 | 86 | — | 35.09% |
|
| radzyński | 49237 | 21894 | 51 | — | 44.47% |
|
| rycki | 48061 | 20306 | 64 | — | 42.25% |
|
| świdnicki | 58895 | 18365 | 53 | — | 31.18% |
|
| tomaszowski | 72629 | 29224 | 92 | — | 40.24% |
|
| włodawski | 33045 | 14571 | 42 | — | 44.09% |
|
| zamojski | 88243 | 38116 | 110 | — | 43.19% |
|
Turnout in cities holding county rights
Go to top| Name | Number of electors | Number of dispensed ballot cards | Number of precincts | Number of precincts with no data supplied | Voting turnout | |
|---|---|---|---|---|---|---|
| m. Biała Podlaska | 45157 | 13893 | 26 | — | 30.77% |
|
| m. Chełm | 55176 | 17416 | 36 | — | 31.56% |
|
| m. Lublin | 277744 | 78040 | 204 | — | 28.10% |
|
| m. Zamość | 53572 | 15066 | 32 | — | 28.12% |
|