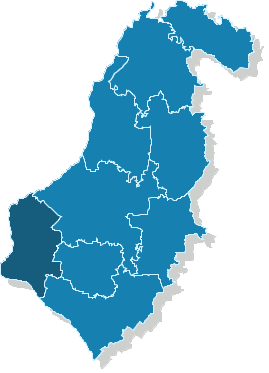
Electoral geography
gm. Cedynia

Statistics
| Commune | gm. Cedynia |
| Number of inhabitants | 4,551 |
| Number of electors | 3,505 |
Mayor election
| Number in the list | Family name and given names | Age | Education | Address, party membership and endorsements | Number of votes | % votes | Elected |
|---|---|---|---|---|---|---|---|
| 1 | Nowak Krzysztof Mirosław | 42 | średnie | Cedynia, submitted by Komitet Wyborczy Wyborców Nasza Cedynia, not a member of any political party | 805 | 40.21% | No |
| 2 | Zarzycki Adam Andrzej | 51 | wyższe | Cedynia, submitted by Komitet Wyborczy Wyborców Rozwój Gminy Cedynia, not a member of any political party | 1197 | 59.79% | Yes |
Statistics
| Number of | Turnout | Number of votes | |||
|---|---|---|---|---|---|
| electors | dispensed ballot cards | cast | valid | % valid | |
| 3504 | 2044 |
58.33% |
2044 | 2002 | 97.95% |