Komitet Wyborczy Wyborców "Samorządność i Demokracja"
| Name: | Komitet Wyborczy Wyborców "Samorządność i Demokracja" | |
| Short name: | KWW "SAMORZĄDNOŚĆ i DEMOKRACJA" | |
| Type of committee: | Election committees established by electors | |
| Address: | Dzierżkowice 11E/2, 59-243 Ruja | |
| Plenipotentiary: | electoral | financial |
| Ireneusz Gerschmann | Ilona Daria Kurczak | |
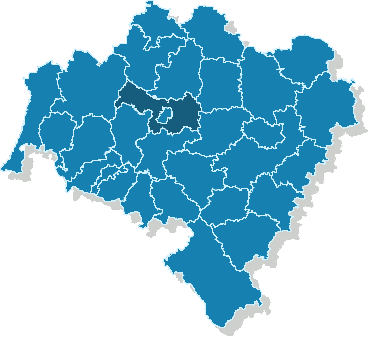
The provinces where the committee has submitted lists of candidates
| Name |
|---|
| pow. legnicki |
The statistics of election committe
Lists submitted
| Description | Number of |
|---|---|
| Number of lists submitted for province council | 0 |
| Number of lists submitted for county councils | 5 |
| Number of lists submitted for councils of cities holding county rights | 0 |
| Number of lists submitted for districts councils of the cap. city of Warsaw | 0 |
| Number of lists registered for communal councils | 44 |
| Totalling | 49 |
Submitted candidates
| Name | Number of candidates | Women | Women (%) | Men | Men (%) |
|---|---|---|---|---|---|
| Number of candidates submitted for the province council | 0 | 0 | - | 0 | - |
| Number of candidates submitted for county councils | 23 | 9 | 39.13% | 14 | 60.87% |
| Number of candidates submitted for councils of cities holding county rights | 0 | 0 | - | 0 | - |
| Number of candidates submitted for districts councils of the cap. city of Warsaw | 0 | 0 | - | 0 | - |
| Number of candidates registered for communal councils | 71 | 26 | 36.62% | 45 | 63.38% |
| Number of candidates submitted for reeve, mayor and presidential elections | 5 | 1 | 20.00% | 4 | 80.00% |
| Totalling | 99 | 36 | 36.36% | 63 | 63.64% |
Average age of submitted candidates
| Name | Average age | Average age of women | Average age of men |
|---|---|---|---|
| Average age of candidates submitted for the province council | - | - | - |
| Average age of candidates submitted for county councils | 49 | 52 | 47 |
| Average age of candidates for councils of cities holding county rights | - | - | - |
| Average age of candidates for districts councils of the cap. city of Warsaw | - | - | - |
| Average age of candidates submitted for communal councils | 44 | 42 | 45 |
| Average age of candidates for reeve, mayor, president | 47 | 38 | 49 |
| Totalling | 45 | 45 | 45 |
Submitted candidates grouped by age
| Name | Number of candidates | Women | Women (%) | Men | Men (%) |
|---|---|---|---|---|---|
| 18-29 | 8 | 3 | 37.50% | 5 | 62.50% |
| 30-39 | 19 | 6 | 31.58% | 13 | 68.42% |
| 40-49 | 32 | 14 | 43.75% | 18 | 56.25% |
| 50-59 | 35 | 12 | 34.29% | 23 | 65.71% |
| 60-69 | 3 | 1 | 33.33% | 2 | 66.67% |
| 70+ | 2 | 0 | 0.00% | 2 | 100.00% |
The youngest and oldest candidate submitted
| Age | Institution | |
|---|---|---|
| Youngest | 20 | Rada Gminy Ruja |
| Oldest | 70 | - gm. Krotoszyce |