Komitet Wyborczy Stowarzyszenia Obywatelski Komitet Samorządowy Ziemi Obornickiej
| Name: | Komitet Wyborczy Stowarzyszenia Obywatelski Komitet Samorządowy Ziemi Obornickiej | |
| Short name: | KW Obywatelski Komitet Samorządowy OKS | |
| Type of committee: | Election committees established by organisations | |
| Address: | ul. Powstańców Wielkopolskich 34/17, 64-600 Oborniki | |
| Plenipotentiary: | electoral | financial |
| Ewa Maria Durasiewicz | Anna Barbara Borowicz | |
The provinces where the committee has submitted lists of candidates
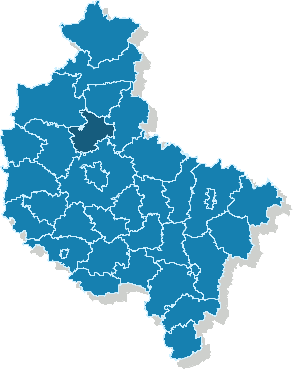
| Name |
|---|
| pow. obornicki |
The statistics of election committe
Lists submitted
| Description | Number of |
|---|---|
| Number of lists submitted for province council | 0 |
| Number of lists submitted for county councils | 2 |
| Number of lists submitted for councils of cities holding county rights | 0 |
| Number of lists submitted for districts councils of the cap. city of Warsaw | 0 |
| Number of lists registered for communal councils | 3 |
| Totalling | 5 |
Submitted candidates
| Name | Number of candidates | Women | Women (%) | Men | Men (%) |
|---|---|---|---|---|---|
| Number of candidates submitted for the province council | 0 | 0 | - | 0 | - |
| Number of candidates submitted for county councils | 23 | 9 | 39.13% | 14 | 60.87% |
| Number of candidates submitted for councils of cities holding county rights | 0 | 0 | - | 0 | - |
| Number of candidates submitted for districts councils of the cap. city of Warsaw | 0 | 0 | - | 0 | - |
| Number of candidates registered for communal councils | 27 | 5 | 18.52% | 22 | 81.48% |
| Number of candidates submitted for reeve, mayor and presidential elections | 1 | 0 | 0.00% | 1 | 100.00% |
| Totalling | 51 | 14 | 27.45% | 37 | 72.55% |
Average age of submitted candidates
| Name | Average age | Average age of women | Average age of men |
|---|---|---|---|
| Average age of candidates submitted for the province council | - | - | - |
| Average age of candidates submitted for county councils | 49 | 46 | 51 |
| Average age of candidates for councils of cities holding county rights | - | - | - |
| Average age of candidates for districts councils of the cap. city of Warsaw | - | - | - |
| Average age of candidates submitted for communal councils | 49 | 52 | 48 |
| Average age of candidates for reeve, mayor, president | 59 | - | 59 |
| Totalling | 49 | 48 | 49 |
Submitted candidates grouped by age
| Name | Number of candidates | Women | Women (%) | Men | Men (%) |
|---|---|---|---|---|---|
| 18-29 | 5 | 1 | 20.00% | 4 | 80.00% |
| 30-39 | 2 | 0 | 0.00% | 2 | 100.00% |
| 40-49 | 18 | 7 | 38.89% | 11 | 61.11% |
| 50-59 | 18 | 4 | 22.22% | 14 | 77.78% |
| 60-69 | 7 | 2 | 28.57% | 5 | 71.43% |
| 70+ | 1 | 0 | 0.00% | 1 | 100.00% |
The youngest and oldest candidate submitted
| Age | Institution | |
|---|---|---|
| Youngest | 22 | Rada Powiatu Obornickiego |
| Oldest | 76 | Rada Powiatu Obornickiego |