Komitet Wyborczy Wyborców DEMOKRATYCZNO-SAMORZĄDOWO-LUDOWY
| Name: | Komitet Wyborczy Wyborców DEMOKRATYCZNO-SAMORZĄDOWO-LUDOWY | |
| Short name: | KWW DEMOKRATYCZNO-SAMORZĄDOWO-LUDOWY | |
| Type of committee: | Election committees established by electors | |
| Address: | ul. Kazimierza Wielkiego 8, 32-700 Bochnia | |
| Plenipotentiary: | electoral | financial |
| Stefan Jerzy Guzik | Jerzy Budzyn | |
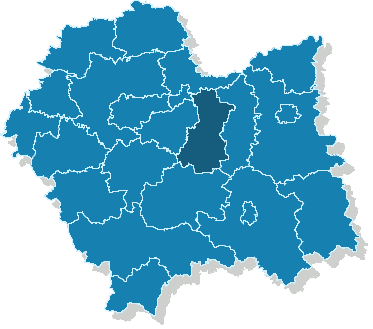
The provinces where the committee has submitted lists of candidates
| Name |
|---|
| pow. bocheński |
The statistics of election committe
Lists submitted
| Description | Number of |
|---|---|
| Number of lists submitted for province council | 0 |
| Number of lists submitted for county councils | 5 |
| Number of lists submitted for councils of cities holding county rights | 0 |
| Number of lists submitted for districts councils of the cap. city of Warsaw | 0 |
| Number of lists registered for communal councils | 29 |
| Totalling | 34 |
Submitted candidates
| Name | Number of candidates | Women | Women (%) | Men | Men (%) |
|---|---|---|---|---|---|
| Number of candidates submitted for the province council | 0 | 0 | - | 0 | - |
| Number of candidates submitted for county councils | 43 | 9 | 20.93% | 34 | 79.07% |
| Number of candidates submitted for councils of cities holding county rights | 0 | 0 | - | 0 | - |
| Number of candidates submitted for districts councils of the cap. city of Warsaw | 0 | 0 | - | 0 | - |
| Number of candidates registered for communal councils | 40 | 11 | 27.50% | 29 | 72.50% |
| Number of candidates submitted for reeve, mayor and presidential elections | 3 | 0 | 0.00% | 3 | 100.00% |
| Totalling | 86 | 20 | 23.26% | 66 | 76.74% |
Average age of submitted candidates
| Name | Average age | Average age of women | Average age of men |
|---|---|---|---|
| Average age of candidates submitted for the province council | - | - | - |
| Average age of candidates submitted for county councils | 51 | 49 | 52 |
| Average age of candidates for councils of cities holding county rights | - | - | - |
| Average age of candidates for districts councils of the cap. city of Warsaw | - | - | - |
| Average age of candidates submitted for communal councils | 47 | 42 | 49 |
| Average age of candidates for reeve, mayor, president | 53 | - | 53 |
| Totalling | 49 | 45 | 50 |
Submitted candidates grouped by age
| Name | Number of candidates | Women | Women (%) | Men | Men (%) |
|---|---|---|---|---|---|
| 18-29 | 2 | 2 | 100.00% | 0 | 0.00% |
| 30-39 | 12 | 4 | 33.33% | 8 | 66.67% |
| 40-49 | 25 | 6 | 24.00% | 19 | 76.00% |
| 50-59 | 36 | 6 | 16.67% | 30 | 83.33% |
| 60-69 | 10 | 2 | 20.00% | 8 | 80.00% |
| 70+ | 1 | 0 | 0.00% | 1 | 100.00% |
The youngest and oldest candidate submitted
| Age | Institution | |
|---|---|---|
| Youngest | 22 | Rada Gminy w Drwini |
| Oldest | 73 | Rada Gminy w Drwini |