Komitet Wyborczy Wyborców Forum Obywatelskie Powiat Wagrowiec.Pl
| Name: | Komitet Wyborczy Wyborców Forum Obywatelskie Powiat Wagrowiec.Pl | |
| Short name: | KWW Forum Obywatelskie Powiat Wagrowiec | |
| Type of committee: | Election committees established by electors | |
| Address: | Antoniewo 3/1, 62-085 Skoki | |
| Plenipotentiary: | electoral | financial |
| Stefania Janowiak | Ryszard Krzysztof Andrzejewski | |
The provinces where the committee has submitted lists of candidates
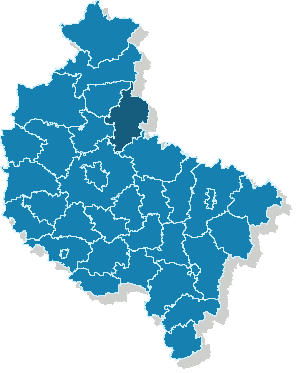
| Name |
|---|
| pow. wągrowiecki |
The statistics of election committe
Lists submitted
| Description | Number of |
|---|---|
| Number of lists submitted for province council | 0 |
| Number of lists submitted for county councils | 4 |
| Number of lists submitted for councils of cities holding county rights | 0 |
| Number of lists submitted for districts councils of the cap. city of Warsaw | 0 |
| Number of lists registered for communal councils | 16 |
| Totalling | 20 |
Submitted candidates
| Name | Number of candidates | Women | Women (%) | Men | Men (%) |
|---|---|---|---|---|---|
| Number of candidates submitted for the province council | 0 | 0 | - | 0 | - |
| Number of candidates submitted for county councils | 35 | 7 | 20.00% | 28 | 80.00% |
| Number of candidates submitted for councils of cities holding county rights | 0 | 0 | - | 0 | - |
| Number of candidates submitted for districts councils of the cap. city of Warsaw | 0 | 0 | - | 0 | - |
| Number of candidates registered for communal councils | 60 | 20 | 33.33% | 40 | 66.67% |
| Number of candidates submitted for reeve, mayor and presidential elections | 1 | 0 | 0.00% | 1 | 100.00% |
| Totalling | 96 | 27 | 28.12% | 69 | 71.88% |
Average age of submitted candidates
| Name | Average age | Average age of women | Average age of men |
|---|---|---|---|
| Average age of candidates submitted for the province council | - | - | - |
| Average age of candidates submitted for county councils | 49 | 38 | 52 |
| Average age of candidates for councils of cities holding county rights | - | - | - |
| Average age of candidates for districts councils of the cap. city of Warsaw | - | - | - |
| Average age of candidates submitted for communal councils | 46 | 43 | 48 |
| Average age of candidates for reeve, mayor, president | 58 | - | 58 |
| Totalling | 47 | 42 | 49 |
Submitted candidates grouped by age
| Name | Number of candidates | Women | Women (%) | Men | Men (%) |
|---|---|---|---|---|---|
| 18-29 | 11 | 5 | 45.45% | 6 | 54.55% |
| 30-39 | 18 | 7 | 38.89% | 11 | 61.11% |
| 40-49 | 17 | 5 | 29.41% | 12 | 70.59% |
| 50-59 | 38 | 9 | 23.68% | 29 | 76.32% |
| 60-69 | 7 | 0 | 0.00% | 7 | 100.00% |
| 70+ | 5 | 1 | 20.00% | 4 | 80.00% |
The youngest and oldest candidate submitted
| Age | Institution | |
|---|---|---|
| Youngest | 20 | Rada Miejska w Wągrowcu |
| Oldest | 75 | Rada Powiatu Wągrowieckiego |