Komitet Wyborczy Wyborców STARE OKĘCIE
| Name: | Komitet Wyborczy Wyborców STARE OKĘCIE | |
| Short name: | KWW STARE OKĘCIE | |
| Type of committee: | Election committees established by electors | |
| Address: | ul. Muszkieterów 6, 02-273 Warszawa | |
| Plenipotentiary: | electoral | financial |
| Beata Małgorzata Jabłońska | Anna Iwona Konarzewska | |
| Name |
|---|
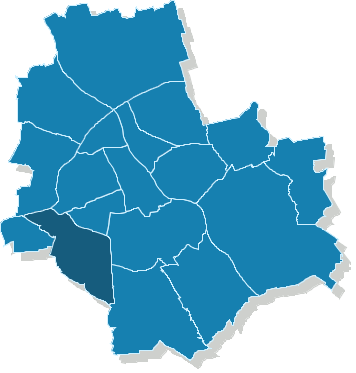
| Włochy |
The statistics of election committe
Lists submitted
| Description | Number of |
|---|---|
| Number of lists submitted for county councils | 0 |
| Number of lists submitted for councils of cities holding county rights | 0 |
| Number of lists submitted for districts councils of the cap. city of Warsaw | 1 |
| Number of lists registered for communal councils | 0 |
| Totalling | 1 |
Submitted candidates
| Name | Number of candidates | Women | Women (%) | Men | Men (%) |
|---|---|---|---|---|---|
| Number of candidates submitted for county councils | 0 | 0 | - | 0 | - |
| Number of candidates submitted for councils of cities holding county rights | 0 | 0 | - | 0 | - |
| Number of candidates submitted for districts councils of the cap. city of Warsaw | 5 | 1 | 20.00% | 4 | 80.00% |
| Number of candidates registered for communal councils | 0 | 0 | - | 0 | - |
| Number of candidates submitted for reeve, mayor and presidential elections | 0 | 0 | - | 0 | - |
| Totalling | 5 | 1 | 20.00% | 4 | 80.00% |
Average age of submitted candidates
| Name | Average age | Average age of women | Average age of men |
|---|---|---|---|
| Average age of candidates submitted for county councils | - | - | - |
| Average age of candidates for councils of cities holding county rights | - | - | - |
| Average age of candidates for districts councils of the cap. city of Warsaw | 37 | 38 | 37 |
| Average age of candidates submitted for communal councils | - | - | - |
| Average age of candidates for reeve, mayor, president | - | - | - |
| Totalling | 37 | 38 | 37 |
Submitted candidates grouped by age
| Name | Number of candidates | Women | Women (%) | Men | Men (%) |
|---|---|---|---|---|---|
| 18-29 | 2 | 0 | 0.00% | 2 | 100.00% |
| 30-39 | 1 | 1 | 100.00% | 0 | 0.00% |
| 40-49 | 2 | 0 | 0.00% | 2 | 100.00% |
| 50-59 | 0 | 0 | — | 0 | — |
| 60-69 | 0 | 0 | — | 0 | — |
| 70+ | 0 | 0 | — | 0 | — |
The youngest and oldest candidate submitted
| Age | Institution | |
|---|---|---|
| Youngest | 21 | Rada Dzielnicy Włochy m. st. Warszawy |
| Oldest | 49 | Rada Dzielnicy Włochy m. st. Warszawy |