Koalicyjny Komitet Wyborczy SLD+SDPL+PD+UP Lewica i Demokraci
| Name: | Koalicyjny Komitet Wyborczy SLD+SDPL+PD+UP Lewica i Demokraci | |
| Short name: | KKW SLD+SDPL+PD+UP Lewica i Demokraci | |
| Type of committee: | Election committees established by coalitions | |
| Address: | ul. Rozbrat 44a, 00-419 Warszawa | |
| Plenipotentiary: | electoral | financial |
| Michał Tober | Edward Kuczera | |
The provinces where the committee has submitted lists of candidates
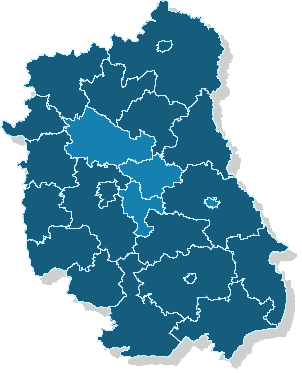
Sejmik Województwa Lubelskiego
Submitted candidates
| Name | Number of candidates | Women | Women (%) | Men | Men (%) | Status |
|---|---|---|---|---|---|---|
| Sum: | 53 | 9 | 16.98% | 44 | 83.02% | |
| Constituency no. 1 | 10 | 2 | 20.00% | 8 | 80.00% |
|
| Constituency no. 2 | 13 | 3 | 23.08% | 10 | 76.92% |
|
| Constituency no. 3 | 11 | 1 | 9.09% | 10 | 90.91% |
|
| Constituency no. 4 | 12 | 1 | 8.33% | 11 | 91.67% |
|
| Constituency no. 5 | 7 | 2 | 28.57% | 5 | 71.43% |
|
Age of the candidates
| Name | Average age | Average age of women | Average age of men | Oldest | Youngest |
|---|---|---|---|---|---|
| Constituency no. 1 | 51 | 50 | 52 | 66 | 27 |
| Constituency no. 2 | 42 | 58 | 38 | 66 | 18 |
| Constituency no. 3 | 49 | 50 | 49 | 75 | 22 |
| Constituency no. 4 | 45 | 44 | 45 | 64 | 29 |
| Constituency no. 5 | 61 | 56 | 62 | 72 | 54 |
The statistics of election committe
Lists submitted
| Description | Number of |
|---|---|
| Number of lists submitted for province council | 5 |
| Number of lists submitted for county councils | 67 |
| Number of lists submitted for councils of cities holding county rights | 14 |
| Number of lists registered for communal councils | 338 |
| Totalling | 424 |
Submitted candidates
| Name | Number of candidates | Women | Women (%) | Men | Men (%) |
|---|---|---|---|---|---|
| Number of candidates submitted for the province council | 53 | 9 | 16.98% | 44 | 83.02% |
| Number of candidates submitted for county councils | 485 | 92 | 18.97% | 393 | 81.03% |
| Number of candidates submitted for councils of cities holding county rights | 145 | 30 | 20.69% | 115 | 79.31% |
| Number of candidates registered for communal councils | 636 | 178 | 27.99% | 458 | 72.01% |
| Number of candidates submitted for reeve, mayor and presidential elections | 23 | 1 | 4.35% | 22 | 95.65% |
| Totalling | 1,342 | 310 | 23.10% | 1,032 | 76.90% |
Average age of submitted candidates
| Name | Average age | Average age of women | Average age of men |
|---|---|---|---|
| Average age of candidates submitted for the province council | 48 | 53 | 47 |
| Average age of candidates submitted for county councils | 48 | 46 | 49 |
| Average age of candidates for councils of cities holding county rights | 48 | 49 | 48 |
| Average age of candidates submitted for communal councils | 46 | 45 | 47 |
| Average age of candidates for reeve, mayor, president | 50 | 60 | 50 |
| Totalling | 47 | 46 | 48 |
Submitted candidates grouped by age
| Name | Number of candidates | Women | Women (%) | Men | Men (%) |
|---|---|---|---|---|---|
| 18-29 | 124 | 29 | 23.39% | 95 | 76.61% |
| 30-39 | 207 | 49 | 23.67% | 158 | 76.33% |
| 40-49 | 329 | 105 | 31.91% | 224 | 68.09% |
| 50-59 | 474 | 102 | 21.52% | 372 | 78.48% |
| 60-69 | 185 | 25 | 13.51% | 160 | 86.49% |
| 70+ | 23 | 0 | 0.00% | 23 | 100.00% |
The youngest and oldest candidate submitted
| Age | Institution | |
|---|---|---|
| Youngest | 18 | Rada Miasta Biała Podlaska |
| Oldest | 75 | Sejmik Województwa Lubelskiego |