Komitet Wyborczy Stowarzyszenia Rozwoju Gmin i Miast Powiatu Garwolińskiego "Wspólnota Powiatowa"
| Name: | Komitet Wyborczy Stowarzyszenia Rozwoju Gmin i Miast Powiatu Garwolińskiego "Wspólnota Powiatowa" | |
| Short name: | KW Stowarzyszenie Wspólnota Powiatowa | |
| Type of committee: | Election committees established by organisations | |
| Address: | ul. Sikorskiego 39, 08-400 Garwolin | |
| Plenipotentiary: | electoral | financial |
| Urszula Zadrożna | Marek Sitek | |
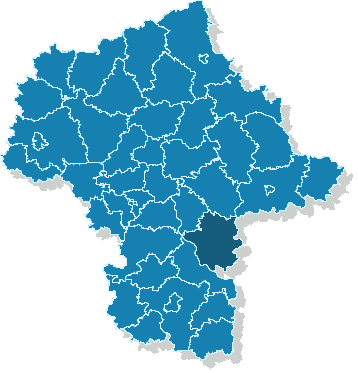
The provinces where the committee has submitted lists of candidates
| Name |
|---|
| pow. garwoliński |
The statistics of election committe
Lists submitted
| Description | Number of |
|---|---|
| Number of lists submitted for province council | 0 |
| Number of lists submitted for county councils | 6 |
| Number of lists submitted for councils of cities holding county rights | 0 |
| Number of lists submitted for districts councils of the cap. city of Warsaw | 0 |
| Number of lists registered for communal councils | 73 |
| Totalling | 79 |
Submitted candidates
| Name | Number of candidates | Women | Women (%) | Men | Men (%) |
|---|---|---|---|---|---|
| Number of candidates submitted for the province council | 0 | 0 | - | 0 | - |
| Number of candidates submitted for county councils | 45 | 15 | 33.33% | 30 | 66.67% |
| Number of candidates submitted for councils of cities holding county rights | 0 | 0 | - | 0 | - |
| Number of candidates submitted for districts councils of the cap. city of Warsaw | 0 | 0 | - | 0 | - |
| Number of candidates registered for communal councils | 121 | 24 | 19.83% | 97 | 80.17% |
| Number of candidates submitted for reeve, mayor and presidential elections | 8 | 2 | 25.00% | 6 | 75.00% |
| Totalling | 174 | 41 | 23.56% | 133 | 76.44% |
Average age of submitted candidates
| Name | Average age | Average age of women | Average age of men |
|---|---|---|---|
| Average age of candidates submitted for the province council | - | - | - |
| Average age of candidates submitted for county councils | 47 | 46 | 48 |
| Average age of candidates for councils of cities holding county rights | - | - | - |
| Average age of candidates for districts councils of the cap. city of Warsaw | - | - | - |
| Average age of candidates submitted for communal councils | 47 | 49 | 47 |
| Average age of candidates for reeve, mayor, president | 53 | 50 | 54 |
| Totalling | 48 | 48 | 48 |
Submitted candidates grouped by age
| Name | Number of candidates | Women | Women (%) | Men | Men (%) |
|---|---|---|---|---|---|
| 18-29 | 4 | 0 | 0.00% | 4 | 100.00% |
| 30-39 | 26 | 7 | 26.92% | 19 | 73.08% |
| 40-49 | 60 | 15 | 25.00% | 45 | 75.00% |
| 50-59 | 71 | 18 | 25.35% | 53 | 74.65% |
| 60-69 | 12 | 1 | 8.33% | 11 | 91.67% |
| 70+ | 1 | 0 | 0.00% | 1 | 100.00% |
The youngest and oldest candidate submitted
| Age | Institution | |
|---|---|---|
| Youngest | 21 | Rada Miasta w Łaskarzewie |
| Oldest | 75 | Rada Gminy w Garwolinie |